Download
1 / 24
240 likes | 341 Views
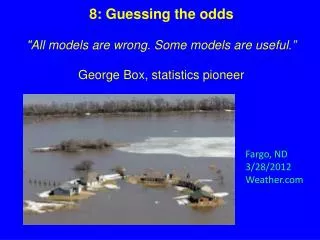
All models are wrong; Some are wronger. Pasky Pascual. Council for Regulatory Environmental Modeling (CREM) U.S. Environmental Protection Agency. at CMAS Conference, 18 October 2006. Abstraction of a Stream. Nothing is less real than realism. It is only by selection, by elimination,

E N D
All models are wrong; Some are wronger Pasky Pascual Council for Regulatory Environmental Modeling (CREM) U.S. Environmental Protection Agency at CMAS Conference, 18 October 2006
Abstraction of a Stream Nothing is less real than realism... It is only by selection, by elimination, by emphasis that we get at the real meaning of things. Georgia O’Keefe
Abstraction of a Stream Chlorophyll (ug/L) Time
Inorganic N (mg/L) Model Observed day Build the black box out of plexiglass
Transparency: Stakeholders understand how uncertain science is used to make a decision. (Research needs on both the Demand and Supply side…)
Model Risk Decision World False -- False ++ TransAtlantic Uncertainty Colloquium
Process for Model Evaluation Legal and Admin Drivers Sources of uncertainty Judicial Review www.modeling.uga.edu/tauc
Is Model Transparency differential? Will it reduce transaction costs over time? UA/SA methods, particulary (a) structural; and (b) over multiple models. CyberInfrastructure (EcoInformatics) for meta-model information TAUC issues:
X X
17,800 hits 1 hit Infrastructure for Meta-Model Info
Custom Software ? Spread sheets Paper Napkin Einstein’s challenge (and Henrion’s query):A (model) should be as simple as possible, but no simpler Ease of use Complexity
Chlorophyll Violations Shellfish Abundance Fish Health Number of Fishkills Exemplar of Model Transparency: Borsuk et al. (a Bayesian Network, using Analytica)
Nitrogen Inputs Algal Density Chlorophyll Violations River Flow Carbon Production Harmful Algal Blooms Sediment Oxygen Demand Frequency of Hypoxia Duration of Stratification Shellfish Abundance Fish Health Number of Fishkills Nodes + Arrows = Narrative
Nitrogen Inputs Algal Density Chlorophyll Violations Carbon Production Sediment Oxygen Demand pr (KillsHypoxia, Health) Hi Med Lo 0.3 0.3 0.3 Frequency of Hypoxia Frequency of Hypoxia 0.8 0.2 0.0 0.0 0.1 0.9 Fish Health Fish Health Number of Fishkills Number of Fishkills 0.7 0.3 0.0 Conditional Probabilities Hypox Health Hi Hi Lo Hi Hi Lo Lo Lo
Nitrogen Inputs Algal Density Chlorophyll Violations Carbon Production Sediment Oxygen Demand pr (KillsHypoxia, Health) Prior Posterior Frequency of Hypoxia Frequency of Hypoxia Fish Health Fish Health Number of Fishkills Number of Fishkills Adaptive Management
Predictive and diagnostic inference Nitrogen Inputs Nitrogen Inputs Algal Density Chlorophyll Violations Chlorophyll Violations Carbon Production Sediment Oxygen Demand Frequency of Hypoxia Frequency of Hypoxia Fish Health Fish Health Fish Health Number of Fishkills Number of Fishkills pr (H/E) pr (E/H) pr (H)
Pfisteria-Like Pfisteria-Like Fish Kills Fish Kills Toxic Pfisteria Toxic Pfisteria ? pr(Pf/~Tox, Kil) pr(Pf/~Tox, ~Kil) = = Causal inferences
Nitrogen Inputs Algal Density Chlorophyll Violations River Flow Carbon Production Harmful Algal Blooms Sediment Oxygen Demand Frequency of Hypoxia Duration of Stratification Shellfish Abundance Fish Health Number of Fishkills Number of Fishkills Analytica explains itself
Nitrogen Inputs Algal Density Chlorophyll Violations River Flow Carbon Production Harmful Algal Blooms SA Sediment Oxygen Demand Frequency of Hypoxia Duration of Stratification VOI Shellfish Abundance Fish Health Number of Fishkills Number of Fishkills Analytica explains uncertainty
Nitrogen Inputs Nitrogen Inputs 5 1 2 3 4 Algal Density Algal Density 4 Frequency of Hypoxia Frequency of Hypoxia Fish Health Fish Health Number of Fishkills Number of Fishkills (1) Graphical model links N to eco health (2) Explains policy choices (3) Adaptive Management (4) Causal mechanisms (5) Explains itself, including uncertainties
Uncertainty Analyses of Models in Integrated Environmental Assessments http://es.epa.gov/ncer/rfa/2006/ 2006_star_uncertainty.html