Download
1 / 15
150 likes | 274 Views
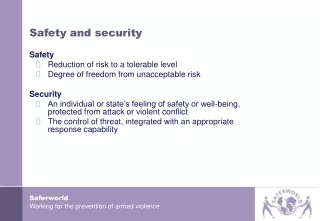
A Multi-Modal Freight Safety, Security and Environmental Tool. Mark Abkowitz & Robert Stammer Vanderbilt University Logistics, Trade and Transportation Symposium 2014 Gulfport, Mississippi. Background.

E N D
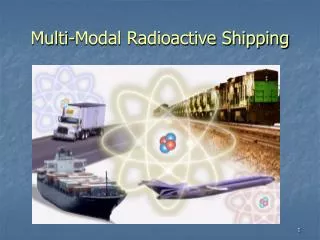
A Multi-Modal Freight Safety, Security and Environmental Tool Mark Abkowitz & Robert Stammer Vanderbilt University Logistics, Trade and Transportation Symposium 2014 Gulfport, Mississippi
Background • 300 million annual hazardous materials shipments are made in the U.S., carrying approximately 3.2 billion tons of cargo. • Incidents involving hazardous materials transport may cause severe consequences in the form of: • Human casualties • Property loss • Environmental degradation • Business & community disruption • Clean-up and recovery costs
Research Objectives • Develop an integrated method for identifying efficient transport routes on highway, rail and waterway while taking safety, security and environmental risk into consideration • Apply this method for the purpose of: 1) locating high-risk “hot spots” and 2) finding preferred routes based on various criteria • Make tool available as web-based application using a geographic information system (GIS) platform
CFIRE Research Team • Vanderbilt University • University of Alabama – Huntsville • University of Wisconsin – Milwaukee • University of Southern Mississippi • University of Wisconsin - Superior
Desirable Decision-Support Tool Requirements • Cover the entire continental U.S. • Represent physical and operating characteristics of freight surface transportation modes • Highway • Rail • Barge • Include relevant feature layers (e.g., schools, stadiums, fire departments, environmentally-sensitive land use) • Capable of performing route optimization based on user-defined criteria • Flexible, modular system architecture • Leverage geographic information systems (GIS) technology • Support users via web-based application
Factors Affecting Routing Decisions • Transportation infrastructure and conditions • Traffic operations and safety • Population exposure • Proximity to vulnerable targets • Location of sensitive environmental areas • Climate conditions • Access to emergency response capability • Political jurisdictions • Regulatory restrictions
Analyze Alternative Routing Criteria • Various stakeholders are interested in different criteria for selecting a preferred route • Candidate routing criteria: • Trip distance • Travel time • Accident likelihood • Population exposure • Proximity to sensitive environmental areas (e.g., lakes, parks, forests) • Proximity to large gathering places (e.g., stadiums, arenas, malls) • Climate conditions • Provides an opportunity to expose tradeoffs in route characteristics based on criteria selection
ESRI ArcGIS Selected As Application Platform • ESRI is market leader in desktop and server GIS products, with access to large GIS data repository of land use, demographics and features • Offers integrated platform with several solution methods available from which to package application (including network analysis) • Active user community, with many examples, templates and sample code snippets available • Supports a variety of export formats • Route optimization can be performed, taking a variety of network attributes and constraints into consideration • Proven web server technology
Feature Layers Icons for each layer appear as either points, polygons or lines, depending on what the feature represents. Point feature layers Polygon feature layers Line feature layers
Expected Outcomes • Enhanced capability from which to improve risk decision-making involving freight transport • Risk evaluation • Situational awareness • Strategic planning • Policy analysis • Demonstrate that sensible approaches exist for considering safety, security and environmental criteria in route selection without significantly compromising efficiency • Recognize that overly imposing routing restrictions can make it: • Impossible to identify a feasible route; or • The preferred route is sufficiently circuitous to render its use a burden to commerce
Future Research Opportunities • Explore ways in which the tool can be utilized • Routing of hazardous materials • Business continuity planning • Evaluation of economic development strategies • Forecasts of freight distribution patterns in response to changing energy supply and demand • Integrating real-time information on network operating conditions • Develop smartphone applications
Thank You! Mark Abkowitz mark.abkowitz@vanderbilt.edu Robert Stammer robert.stammer@vanderbilt.edu