Download
1 / 95
950 likes | 959 Views
This research aims to study the spread of Ebola infection in Guinea, Sierra Leone, Liberia, and Democratic Republic of the Congo using mathematical models. By analyzing the data and predicting the number of infected individuals and deaths, the effectiveness of control measures can be assessed.

E N D
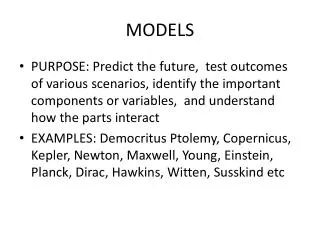
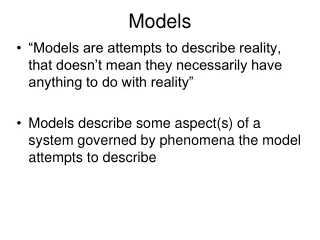
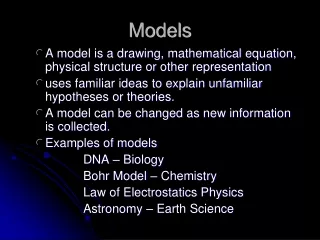
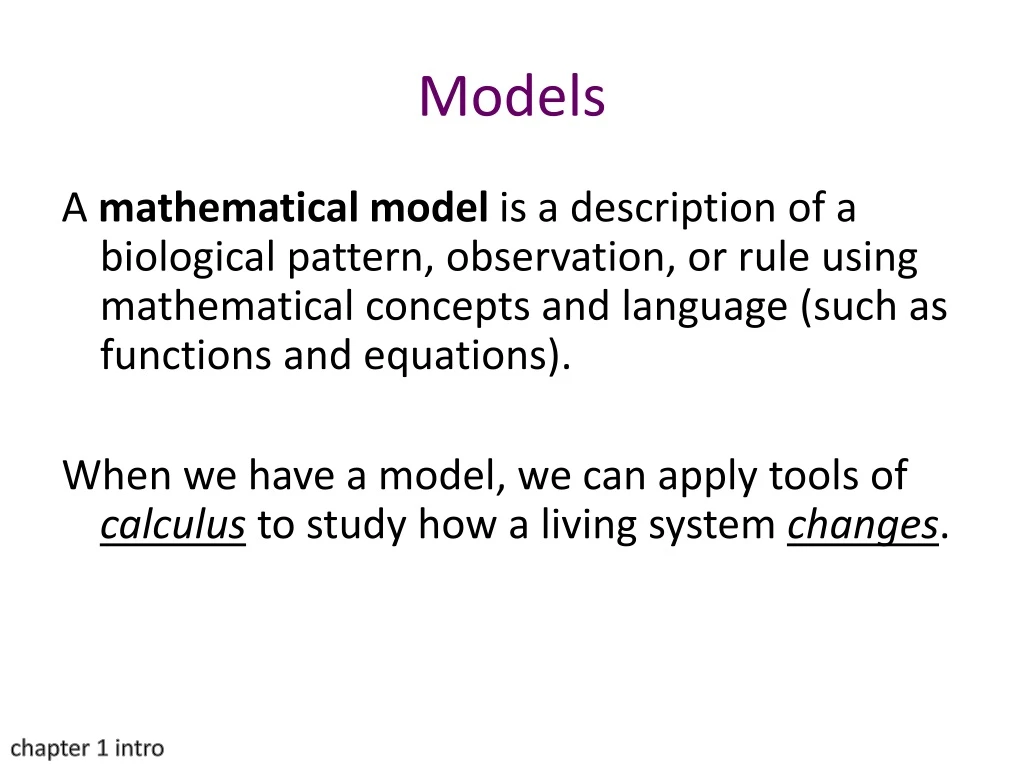
Models A mathematicalmodel is a description of a biological pattern, observation, or rule using mathematical concepts and language (such as functions and equations). When we have a model, we can apply tools of calculus to study how a living system changes. chapter 1 intro
Ebola (EBOV) outbreak in West Africa Research needed to understand the spread of infection, so that it can be controlled effectively new research since previous models were not adequate
Research goal: study infections in three countries Guinea, Sierra Leone and Liberia in 2014/2015 and in 2019, in Democratic Republic of the Congo Start with data (WHO=World Health Organization) http://www.afro.who.int/en/clusters-a-programmes/dpc/epidemic-a-pandemic-alert-and-response/outbreak-news.html Data taken from 22 March to 20 August 2014
… • …
How to make sense of these numbers? Research question: based on the data available until 20 August 2014, predict the number of infected individuals and the number of deaths for September 2014, to determine if present control measures work, or need to be modified
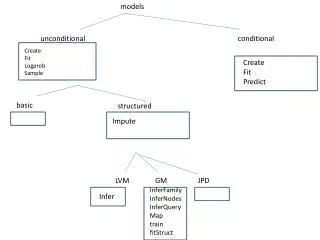
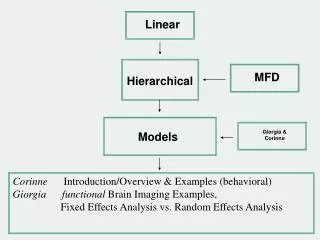
Math model Divide the population into four groups: S = susceptible E = exposed I = infected R = recovered and build mathematical relationships between these groups
We will learn math which will help us understand all this!
Look at the first equation derivative=rate of change, so this equation describes how the number of susceptible people changes over time due to the infection
Look at the first equation the derivative is negative (because all terms on the right side are positive), so the number of susceptible people decreases (due to exposure and infection)
Look at the first equation the rate of change is proportional to the number of susceptible people S and to the proportion I/N of the total population N who are infected the constant of proportionality changes with time, so is a function of t
Look at the first equation this is called a differential equation to solve for S we have to un-apply the derivative, i.e., we have to use integration
Solution: represent data and results visually (red=number of infected; black=number of deaths) Which curves best describe the WHO data? We will study logistic (left and middle), exponential growth (right), and many other curves
When the differential equations are solved, researchers are able to compute the effective reproduction number Re (= number of secondary infections generated by an infected individual after control measures are put into place) The predictions are that by September 2014, Guinea and Sierra Leone … Re<1 (control measures work, infections will be declining) Liberia … Re about 1.6 (need much better control measures in order to stop the outbreak)
20 August 2015: Epidemic is over! Many people died
20 August 2015, a year later: how good was the model? Data as reported to World Health Organization:
important fact about logistic growth (we will discuss details later) the value where there is a change in the pattern of increase is the inflection point height at inflection = one-half of the horizontal asymptote, i.e., one-half of maximum
20 August 2015, a year later: how good was the model? inflection bit below 400 estimated total 800 actual: 2524 inflection around 400 estimated total 800 actual: 3951 no inflection detected after 1000 deaths thus total deaths > 2000 actual: 4806
all predictions made in 2014 were large underestimates • many possible reasons, including: • the model described in this paper is not adequate • the model assumed that the control measures that existed in September 2014 would not change (in reality, due to the lack of resources, the measures weakened at times) • data that was available in August 2014 (based on which the model was run) was inaccurate; for instance, deaths in remote areas were not reported
As well … • there were secondary infections coming from outside the countries studied, which were not predicted by the model • it is hard to control humans and their behaviour – infectious diseases come back (after SARS was nearly eradicated in Toronto, there was a second outbreak) • causes of infections can lay dormant and then reappear (as in DRC in 2019)
Important message: We need to learn math in order to understand a vastly increasing number of publications in biology and health sciences which use mathematics and statistics Even if you do not plan to become a researcher, you will need to read and understand all kinds of documents, manuals, and reports which use quantitative information
Is this going to be on the test? Yes, but only after we cover all math that’s necessary We will be explicit about what each test covers (as well, there are sample tests in your coursepack)
Dynamical Systems • Discrete-time dynamical systems describe a sequence of measurements made at equally spaced intervals • Continuous-time dynamical systems, usually known as differential equations, describe measurements that change continuously section 1.2
Conversion of units To be studied independently… look at tables in section 1.2, do conversion, etc. (assignment 5) section 1.2
Relations and Functions A relation between two variables is the set of all pairs of values that occur. A function is a special type of relation. section 1.3
Functions A function f is a rule that assigns to each real number x in some set D (called the domain) a unique real number f(x) in a set R (called the range). section 1.3
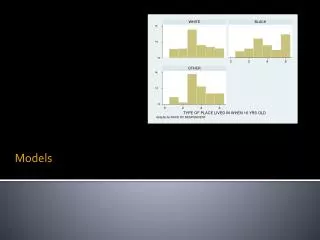
Most (almost all) DATA collected in life sciences reflect a RELATIONSHIP, but not necessarily a specific FUNCTION Example: the graph on the next slide shows the cranial capacity (i.e., the brain volume) calculated from the skulls of early humans and modern humans, between 3 million years in the past and today
This diagram shows a relationship (sometimes called a relation), but it is not a function
Using statistical methods such as regression (these methods are covered in statistics courses in levels 2 and above), we can identify a function which approximates the data
And then we work with the function we obtained. Why? Because we have no choice. In order to obtain the quantitative results desired in our research in the life sciences, we need to model the relationship with a function.
Of course, we can say something … for example, the data on the left suggests some kind of exponential growth. But in order to quantify that growth, and further work with it, we need to have a function
Domain The domain of a function f is the largest set of real numbers (possible x-values) for which the function is defined (as a real number). Example: Find the domain of the following functions. section 1.3
Graphs The graph of a function f is a curve that consists of all points (x,y) where x is in the domain of f and y=f(x). Example: Sketch the graph and find the domain and range of section 1.3
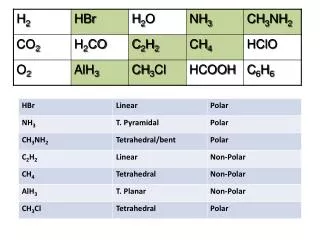
Piecewise Functions A piecewise function f(x) is a function whose definition changes depending on the value of x. Example: Absolute Value Function The absolute value of a number x, denoted by |x|, is the distance between x and 0 on the real number line. section 1.3
Piecewise Functions Example: Sketch the graph of f(x). section 1.3
Variables and Parameters A variable represents a measurement that can change during the course of an experiment. A parameter represents a measurement that remains constant during an experiment but can change between different experiments. section 1.3
Variables and Parameters Example: Body Mass Index (BMI) where m is a person’s mass in kilograms and h is their height in metres. BMI is the dependent variable; m and h are the two independent variables. section 1.3
When BMI makes no sense … 9-year old girl Ana Source: http://www.cnn.com/video/data/2.0/video/us/2014/05/26/mxp-wabc-bmi-school-program-girl-overweight.hln.html
According to her school administrators, Ana is overweight …
Ana: height = 4 ft 1 in = 1.25 m mass = 66 lb = 29.94 kg = 30kg BMI=mass/height^2 = 19.2
PATTERNS OF CHILD GROWTH VARY SIGNIFICANTLY – NO STRAIGHTFORWARD RELATION BETWEEN HEIGHT AND WEIGHT REASONING BASED ON BMI DOES NOT APPLY TO CHILDREN !!!
Evidence: [Cogan, Smith, Maine (2008). The risks of a quick fix: a case against mandatory body mass index reporting laws. Eat Disord. 2008 Jan-Feb;16(1):2-13. doi: 10.1080/10640260701771664.] This article describes the state level activity on mandatory BMI reporting, offers numerous arguments against this practice, and suggests an alternative approach to promoting health in youth. Mandatory BMI reporting laws place a new and inappropriate responsibility on the schools. Proponents of such laws imply that BMI reporting will have positive outcomes, yet there is virtually no independent research to support this assumption. The authors argue that these laws could do significant harm, including an increased risk for children to develop eating disorder symptoms.
According to her school administrators, Ana is overweight … NONSENSE !!!!!!!! This kind of reasoning only hurts children, yet the above school officials DID NOT CHANGE their opinion. They continue using BMI to “help students get healthy.” Conclusion: there is no boundary to human stupidity, and worse.
Variables and Parameters We can study how a function depends on one of its variables at a time by holding all other variables constant. For example, to study how BMI depends on mass, we fix height to be constant (i.e., collect data from all people of the same height). section 1.3
Proportional and Inversely Proportional Relationships Example: Body Mass Index (BMI) Note: BMI is proportional to mass. If a person’s mass changes (and their height remains the same), then their BMI will change by the same amount. section 2.1