Download

1 / 52
530 likes | 725 Views
The E ra of Personalised Healthcare: Designing Clinical Studies with Biomarkers. Ugochi Emeribe, PhD. Outline. Background concepts, and r etrospective analyses of Gefitinib ( Iressa ) trial Classic Designs using Biomarkers Classifier, Prognostic and Predictive Biomarkers

E N D
The Era of Personalised Healthcare: Designing Clinical Studies with Biomarkers Ugochi Emeribe, PhD
Outline • Background • concepts, and retrospective analyses of Gefitinib (Iressa) trial • Classic Designs using Biomarkers • Classifier, Prognostic and Predictive Biomarkers • Sample Size Calculations • Validating Biomarkers • surrogate Biomarkers • Conclusions
SPECIAL REPORT-Big Pharma's global guinea pigsChicago TribuneMonday, May 9, 2011 8:13 AM CDT As drug treatments become more targeted, scientists are unraveling how small genetic variations may make one medicine suitable for a particular group of people. AstraZeneca's lung cancer drug Iressa, for example, failed to help Western patients overall in tests but proved much more effective in Asians -- a discovery that has shed valuable new light on ways of tackling the disease worldwide.“We are starting to understand ethnic differences through the responses seen in global trials. By cherishing our genetic diversity we can identify biomarkers like the one for Iressa. That is really exciting.” says Dr. David Kerr, president of the European Society for Medical Oncology.
Herceptin is seen as the poster child for PHC But a classic example of a drug development that did not start with PHC in mind is Gefitinib What is Personalized Health Care? Matching individual patient characteristics with drugs that produce better outcomes for that patient Perfect Medicine • Effective in all patients! • The same dose for every patient! • No side effects! Real Medicines • Effective only in some patients • Dose varies for different patients • Some patients may develop adverse events
Retrospective Analyses of Gefitinib Trials • EGFR Mutation- first thought to be predictive was actually prognostic • EGFR Gene Amplification- first thought to be prognostic was actually predictive
1.0 1.0 Gefitinib 250/500mg and EGFR M– (n = 65) Gefitinib 250/500mg and EGFR M– (n = 65) I 0.8 I I I 0.8 I I I I I I I I I I I I I I I 0.6 I I I I I Proportion event free I Proportion event free I I I I 0.6 I I 0.4 I I I I I I I I I 0.4 I I I 0.2 I I I I I I I 0.2 0.0 0 2 4 6 8 10 12 0 2 4 6 8 10 12 Progression free survival time (months) Survival time (months) 0.0 Gefitinib 250/500mg and EGFR M+ (n = 14) Gefitinib 250/500mg and EGFR M+ (n = 14) EGFR mutation status • Median TTP for EGFR mutation +ve cases was longer (116 days, range 25-171), than that for mutation -ve cases (57 days, range 28-170) • There was no impact on OS
EGFR gene amplification FISH: technique for measuring increased EGFR gene copy FISH + FISH - N=114, E=68Cox HR=0.61 (0.36, 1.04)p=0.07 N=256, E=157Cox HR=1.16 (0.81, 1.64)p=0.42 Proportion surviving 1.0 1.0 Gefitinib Gefitinib Placebo Placebo 0.8 0.8 0.6 0.6 0.4 0.4 0.2 0.2 0.0 0.0 0 2 4 6 8 10 12 14 16 0 2 4 6 8 10 12 14 16 Time (months) Time (months) Interaction test: p=0.04
50 40 30 20 10 0 FISH positive status and clinical characteristics % of FISH positive patients 60 No. patients with evaluable samples: Adeno Other Never Ever Asian origin Other Female Male 214 322 359 156 48 11 117 253 Histology Smoking Ethnicity Gender
Conclusions from Gefitinib trials • FISH+ status is the biomarker which is the strongest predictor of Gefitinib benefit on OS • Patients who are FISH- are unlikely to benefit from Gefitinib therapy. • Therefore, EGFR amplification is a predictive marker for benefit with Gefitinib therapy.
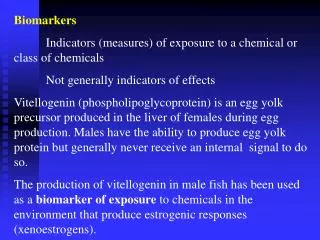
Definitions • Clinical Endpoint (or Outcome) : A characteristic or variable that reflects how a patient feels, functions, or how long a patient survives. • Biomarker (or Biological marker): A characteristic objectively measured as an indicator of normal biologic or pathogenic process, or pharmacologic responses to a therapeutic intervention. • measured once before treatment • Types of Biomarkers • Prognostic • Predictive
Prognostic vs Predictive • Prognostic markers indicate that clinical outcome is independent of treatment. • Stage of disease is a prognostic marker for survival outcome. • Predictive biomarkers show treatment effect on the clinical endpoint. • High Her-2 gene copy number in advanced breast cancer is predictive for the effect of Herceptin. • Statistically, a predictive marker is a marker that interacts with treatment “significantly.”
…therefore it is obvious that a biomarker targeted approach to drug development will lead to smaller, more secure and more successful developments • losers will be dropped early and winners taken forward, resulting in more successful drug development…
How about this? • 100 treatment resistant patients are offered a new drug • 70 respond and 30 do not. • How do we interpret this experiment?
Which is the correct interpretation? • A - Treatment works for 70% of patients 100% of the time and for 30% of patients 0% of the time. • Or… • B - Treatment works in 100% of patients 70% of the time.
Which is the correct interpretation? • A - No within patient variability –patients are deterministically responders or non responders • B - Within patient variability –drug has some effect in all patients, but patients vary in their response –sometimes they respond, sometimes they don’t
What does this mean? • In most situations, it is impossible to know if patients respond deterministically • To know for sure requires repeat administration of drug (and control) in within-patient crossover trials However, such trials are impossible in many settings, especially oncology, so that there is little choice but to assume interpretation A.
Suppose biomarker target identified in patients treated with drug, show target +vepatients do better than target –vepatients % surviving or progression-free Time
…suppose the same is true for patients treated with control, target +vepatients do better than target –vepatients % surviving or progression-free Time
This is an example of a prognostic biomarker • Patients with the biomarker do better than those without it irrespective of the treatment they receive • This biomarker is not predictive for the effect of drug over control • Using this biomarker as a basis for patient selection is unlikely to result in a positive outcome for drug
Predictive vs. Prognostic Predictive Prognostic
Biomarker +vepatients treated with drug do better than biomarker +vepatients treated with control % surviving or progression-free Time
This is an example of a predictive biomarker biomarker • +vepatients do better when treated with drug than when treated with control • biomarker –vepatients do less well on both drug and control
So, we need to stratify on receptor status and then randomize to drug and no drug to assess the true potential of a drug
Therefore, data from a properly designed Phase II trial could be used to assess the true value of receptor status
Just an example 1median follow-up of 18 months assumed
To validate biomarkers…… Sensitivity Pr(test +ve/true +ve) Specificity Pr(test –ve/true –ve) Positive Predictive Value Pr(true +ve/test +ve)
An imperfect test lessens the advantage of a biomarker strategy
Anyway, assume we have the perfect test, what happens if there is some modest effect in –ve pts? Is a selected design still best?
Even a small effect in biomarker –vepts erodes the advantage of a biomarker strategy Effect in –vepts = 1/3 effect in +vepts
Likely the relationship between treatment effect and biomarker level is continuous, reflecting underlying biology
In a biomarker strategy we would need to be very confident that • we had a very good test • the biomarker ‘-ve’ population achieved no or very little benefit from treatment
In late phase development, testing across the population offers some advantages
Power the trial for an “interaction” • “Is there any statistical evidence that the treatment effect in +vepts is different to the treatment effect in -ve pts?” • If “Yes”, valid to look at +ve and -ve groups separately. • Possibility of labeling in (+) pts. • If “No”, then there is no statistical rationale for looking at +ve and –ve patients separately. • Compare treatments in the overall population, irrespective of biomarker status.
An example • Treatment A is either better or worse than treatment B (qualitative interaction) • Treatment HR = 0.74 • Interaction HR = HR(+vepts) / HR(-vepts) = 0.48 / 2.85 = 0.17 • If interaction effect size is better that treatment effect size • Than interaction is highly significant
Power of Interaction Test • Interaction test has very low power • So, validation of predictive biomarker is more complicated ---due to limited power of the interaction test • It is known that as inflation factor for total sample size decreases, so does interaction effect size in relation to overall treatment effect size. • Therefore, inflation factor is required to increase the sample size to ensure interaction test has the same power as the original sample size calculated for overall treatment effect.
Design can provide confirmatory evidence in either all patients or the subset of biomarker +ve patients
Alternatively, patient selection adaptive designs can identify those patients most likely to benefit Interim Continuance Randomize
The need for surrogate endpoints • In many settings, the primary clinical endpoint takes large, long term trials • Breast cancer recurrence, cardiac events, osteoporotic fracture, death from prostate cancer • To reduce time and expense and to bring effective medicines to patients quickly requires use of surrogate endpoints
Statistical definition of Surrogacy • “A response variable for which the test of the null hypothesis of no relationship to the treatment groups under comparison is also a valid test of the corresponding hypothesis based on the true endpoint.” by Prentice, (1989)
The Problem with Prentice Criteria based on Prentice’s definition are problematic • Cannot prove the null • The ‘%’ effect retained is not a true percentage, and CI for the ‘%’ effect retained is usually very wide • Cannot realistically expect 100% of a drug effect on OS to be explained by a direct effect on the disease itself.
Newer Approaches to Surrogacy • That reliably predict drug effect on a later clinical outcome (e.g. OS or PFS) given the effect of drug on some earlier endpoint. • Buyse and Molenbergs (2000, 2002) provided a meta-analytic methodology for doing just this. • Unlike Prentice, this approach does not require proving the null nor the presence of a significant treatment effect.
Strong evidence of surrogacy: Relation between tumor response to first-line chemotherapy and survival in advanced colorectal cancer: a meta-analysis R2=0.97
Using methodology to quantitate uncertainty in prediction Ovarian cancer
Conclusions • There should be an assurance that selected test for biomarker is correct. So, validation of biomarkers in early in drug development is imperative. • Treatment interaction effect has to be factored in sample size calculation for late phase studies.