Download
1 / 28
280 likes | 439 Views
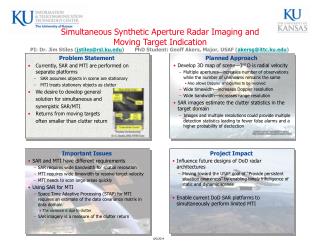
Satellite, radar and lightning data. Simultaneous satellite and radar data The radar images overlaid on satellite images are always interpolated in time (using displacement vector fields) to the satellite ‘European time’ (nominal + 10 minutes). (P. Németh) The parallax effect is not corrected.

E N D
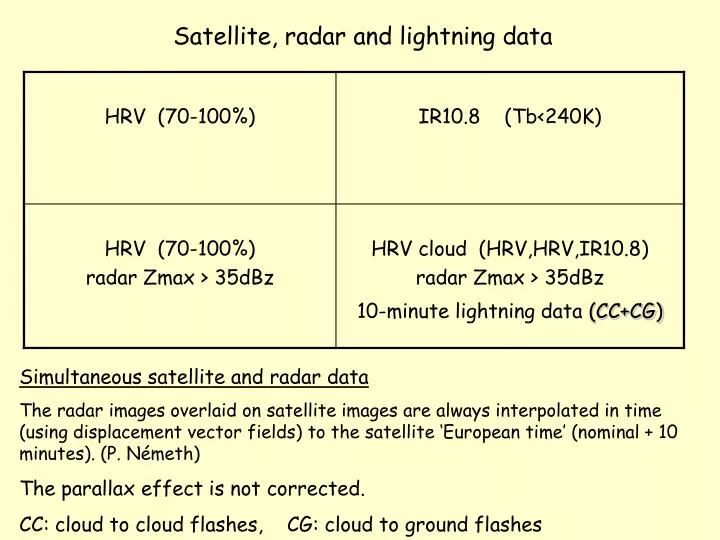
Satellite, radar and lightning data Simultaneous satellite and radar data The radar images overlaid on satellite images are always interpolated in time (using displacement vector fields) to the satellite ‘European time’ (nominal + 10 minutes). (P. Németh) The parallax effect is not corrected. CC: cloud to cloud flashes, CG: cloud to ground flashes
Lightning In the updraft part of a cell many collisions happen between cloud particles, and the particles may became electrically charged. The positive and negative charges accumulate in different parts of the clouds. The generated poles cause discharges: first intra-cloud then cloud-to-ground flashes of lightning. The highest number of discharges occur in the closed ambience of the overshooting top.
Developing stage -- single cell • The following features characterize the developing of a single cell: • The developing stage lasts 5 to 10 minutes • A distinct single updraft is prevailing • The diameter of the cell is between 2 and 8 km • At the end of this stage lightning is most intense Lightning in the upstream part of Cb/MCS
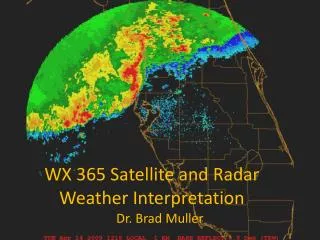
Lightning activity was extremly high in this MCS, more then 1000 CC (cloud to cloud) flashes were detected per 10 minutes between 6-11UTC. Between 10:10-10:20UTC almost 8000 CC flashes were detected.
HRV (70-100%) IR10.8 (<240K) HRV (70-100%) Radar Zmax (>35dBz) HRV cloud Radar Zmax (>35dBz) 10min lightning
Overshooting top Parallax shift
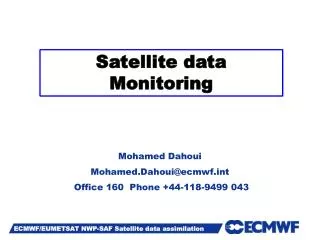
Overshooting top Cold rings, cold U shape High radar reflectivities close to overshooting tops The majority of lightnings are close to overshooting tops
Overshooting top Cold rings, cold U shape
Overshooting top Cold rings, cold U shape
Plume Overshooting top CC CG
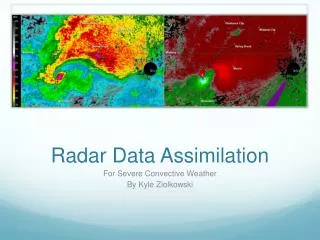
Radial Ci Overshooting top Bow echo After this less flashes
The number of the flashes decreased at about 11UTC and further decreased after 12UTC. The system became less active.