Download
1 / 53
530 likes | 813 Views
NG-MON: Next Generation Network Traffic MONitoring and Analysis System ... Internet Traffic Monitoring and Analysis. Bursty data transfer vs. Streaming data transfer ...

E N D
Slide 1:Internet Traffic Monitoring and Analysis
? ? ? ??????? ?????? ???? ? ?????? ??? jwkhong@postech.ac.kr http://dpnm.postech.ac.kr/ Tel: 054-279-2244 Abstract Most Internet networking devices are now equipped with a Web server for providing Web-based element management so that an administrator may take advantage of this enhanced and powerful management interface. On the other hand, for network management, an administrator normally buys and deploys SNMP-based network management platform to be customized to his network. Each management scheme has mutually exclusive advantages; consequently, two schemes coexist in the real world. This results in both a high development cost and a dual management interface for administrator. We propose an embedded Web server (EWS)-based network management architecture as an alternative to an SNMP based network management and to leverage on already existing embedded web server. We extend EWS-based element management architecture to the network management architecture. Our proposed architecture uses HTTP as a communication protocol with management information and operation encoding. Further we designed a management system on the basis of our proposed architecture that supports basic management functions. Abstract Most Internet networking devices are now equipped with a Web server for providing Web-based element management so that an administrator may take advantage of this enhanced and powerful management interface. On the other hand, for network management, an administrator normally buys and deploys SNMP-based network management platform to be customized to his network. Each management scheme has mutually exclusive advantages; consequently, two schemes coexist in the real world. This results in both a high development cost and a dual management interface for administrator. We propose an embedded Web server (EWS)-based network management architecture as an alternative to an SNMP based network management and to leverage on already existing embedded web server. We extend EWS-based element management architecture to the network management architecture. Our proposed architecture uses HTTP as a communication protocol with management information and operation encoding. Further we designed a management system on the basis of our proposed architecture that supports basic management functions.
Slide 2:Table of Contents
Introduction Real-World Applications of Traffic Monitoring and Analysis POSTECH R&D Activities in Traffic Monitoring and Analysis NG-MON: Next Generation Network Traffic MONitoring and Analysis System Summary
Slide 3:1. Introduction � Growth of Internet Use
The number of Internet users is growing Source : Nua Inc. Internet traffic has increased dramatically Source: America�s Network ------------------------------------------------------------------------------------------------------------------------------------------------------------- [http://http://www.caida.org/outreach/metricswg/faq.xml] CAIDA ? Outreach ? Network Measurement FAQ 2.1. Why should I measure my network's behaviour? If you don't measure it, you have no objective record or benchmark of how it behaves. This could make it difficult to judge whether changes in the network have improved its performance, or degraded it. If you are buying Internet connectivity from an ISP you need to understand the kind of service being offered, and you need to measure the actual performance so as to verify that you're getting what you pay for. ------------------------------------------------------------------------------------------------------------------------------------------------------------- [KRNET Tutorial] http://dpnm.postech.ac.kr/webboard/ Internet Traffic Monitoring & Analysis User�s Needs * Monitor the performance experienced by one�s application - Why is the web page download so slow? - Why is my multicast video stream jerky? * Check if level of service meets one�s need - Do I have enough b/w? * Check if one experiences intrusions and attacks - Is someone attacking me? Service provider�s needs * Monitor the current level of activity * Enforce SLAs(service level agreements) * Detect faults and failures * Engineer the network for better performance * Plan for future capacity * Feedback to customers ------------------------------------------------------------------------------------------------------------------------------------------------------------------------------------------------------------------------------------------------------------------------------------ [http://http://www.caida.org/outreach/metricswg/faq.xml] CAIDA ? Outreach ? Network Measurement FAQ 2.1. Why should I measure my network's behaviour? If you don't measure it, you have no objective record or benchmark of how it behaves. This could make it difficult to judge whether changes in the network have improved its performance, or degraded it. If you are buying Internet connectivity from an ISP you need to understand the kind of service being offered, and you need to measure the actual performance so as to verify that you're getting what you pay for. ------------------------------------------------------------------------------------------------------------------------------------------------------------- [KRNET Tutorial] http://dpnm.postech.ac.kr/webboard/ Internet Traffic Monitoring & Analysis User�s Needs * Monitor the performance experienced by one�s application - Why is the web page download so slow? - Why is my multicast video stream jerky? * Check if level of service meets one�s need - Do I have enough b/w? * Check if one experiences intrusions and attacks - Is someone attacking me? Service provider�s needs * Monitor the current level of activity * Enforce SLAs(service level agreements) * Detect faults and failures * Engineer the network for better performance * Plan for future capacity * Feedback to customers -----------------------------------------------------------------------------------------------------------------------
Slide 4:1. Introduction - Evolving IP Network Environment
WAN: SONET/SDH (OC3, OC12, OC48, OC192), ATM, WDM/DWDM LAN: 10/100 Mbps to 1 Gbps to 10 Gbps Ethernet Broadband Internet Access: Cable Modem, ADSL, VDSL Wireless Access: WLAN (IEEE 802.11), Wireless Internet Wired/Wireless Convergence: Softswitch, Media Gateway, NGCN ------------------------------------------------------------------------------------------------------------------------------------------------------------- [http://http://www.caida.org/outreach/metricswg/faq.xml] CAIDA ? Outreach ? Network Measurement FAQ 2.1. Why should I measure my network's behaviour? If you don't measure it, you have no objective record or benchmark of how it behaves. This could make it difficult to judge whether changes in the network have improved its performance, or degraded it. If you are buying Internet connectivity from an ISP you need to understand the kind of service being offered, and you need to measure the actual performance so as to verify that you're getting what you pay for. ------------------------------------------------------------------------------------------------------------------------------------------------------------- [KRNET Tutorial] http://dpnm.postech.ac.kr/webboard/ Internet Traffic Monitoring & Analysis User�s Needs * Monitor the performance experienced by one�s application - Why is the web page download so slow? - Why is my multicast video stream jerky? * Check if level of service meets one�s need - Do I have enough b/w? * Check if one experiences intrusions and attacks - Is someone attacking me? Service provider�s needs * Monitor the current level of activity * Enforce SLAs(service level agreements) * Detect faults and failures * Engineer the network for better performance * Plan for future capacity * Feedback to customers ------------------------------------------------------------------------------------------------------------------------------------------------------------------------------------------------------------------------------------------------------------------------------------ [http://http://www.caida.org/outreach/metricswg/faq.xml] CAIDA ? Outreach ? Network Measurement FAQ 2.1. Why should I measure my network's behaviour? If you don't measure it, you have no objective record or benchmark of how it behaves. This could make it difficult to judge whether changes in the network have improved its performance, or degraded it. If you are buying Internet connectivity from an ISP you need to understand the kind of service being offered, and you need to measure the actual performance so as to verify that you're getting what you pay for. ------------------------------------------------------------------------------------------------------------------------------------------------------------- [KRNET Tutorial] http://dpnm.postech.ac.kr/webboard/ Internet Traffic Monitoring & Analysis User�s Needs * Monitor the performance experienced by one�s application - Why is the web page download so slow? - Why is my multicast video stream jerky? * Check if level of service meets one�s need - Do I have enough b/w? * Check if one experiences intrusions and attacks - Is someone attacking me? Service provider�s needs * Monitor the current level of activity * Enforce SLAs(service level agreements) * Detect faults and failures * Engineer the network for better performance * Plan for future capacity * Feedback to customers -----------------------------------------------------------------------------------------------------------------------
Slide 5:1. Introduction � Reliance on Internet
The Internet generated revenue has been increasing rapidly! Source : Active Media. Internet�s importance and reliance are increasing! ------------------------------------------------------------------------------------------------------------------------------------------------------------- [http://http://www.caida.org/outreach/metricswg/faq.xml] CAIDA ? Outreach ? Network Measurement FAQ 2.1. Why should I measure my network's behaviour? If you don't measure it, you have no objective record or benchmark of how it behaves. This could make it difficult to judge whether changes in the network have improved its performance, or degraded it. If you are buying Internet connectivity from an ISP you need to understand the kind of service being offered, and you need to measure the actual performance so as to verify that you're getting what you pay for. ------------------------------------------------------------------------------------------------------------------------------------------------------------- [KRNET Tutorial] http://dpnm.postech.ac.kr/webboard/ Internet Traffic Monitoring & Analysis User�s Needs * Monitor the performance experienced by one�s application - Why is the web page download so slow? - Why is my multicast video stream jerky? * Check if level of service meets one�s need - Do I have enough b/w? * Check if one experiences intrusions and attacks - Is someone attacking me? Service provider�s needs * Monitor the current level of activity * Enforce SLAs(service level agreements) * Detect faults and failures * Engineer the network for better performance * Plan for future capacity * Feedback to customers ------------------------------------------------------------------------------------------------------------------------------------------------------------------------------------------------------------------------------------------------------------------------------------ [http://http://www.caida.org/outreach/metricswg/faq.xml] CAIDA ? Outreach ? Network Measurement FAQ 2.1. Why should I measure my network's behaviour? If you don't measure it, you have no objective record or benchmark of how it behaves. This could make it difficult to judge whether changes in the network have improved its performance, or degraded it. If you are buying Internet connectivity from an ISP you need to understand the kind of service being offered, and you need to measure the actual performance so as to verify that you're getting what you pay for. ------------------------------------------------------------------------------------------------------------------------------------------------------------- [KRNET Tutorial] http://dpnm.postech.ac.kr/webboard/ Internet Traffic Monitoring & Analysis User�s Needs * Monitor the performance experienced by one�s application - Why is the web page download so slow? - Why is my multicast video stream jerky? * Check if level of service meets one�s need - Do I have enough b/w? * Check if one experiences intrusions and attacks - Is someone attacking me? Service provider�s needs * Monitor the current level of activity * Enforce SLAs(service level agreements) * Detect faults and failures * Engineer the network for better performance * Plan for future capacity * Feedback to customers -----------------------------------------------------------------------------------------------------------------------
Slide 6:Traditional Internet Applications Web, FTP, Email, Telnet, etc. Emerging Internet applications Online games, shopping, banking, stock trading, network storage VOD, EOD, VoIP P2P applications � instant messaging, file sharing
1. Introduction � Internet Applications
Slide 7:Peer-to-Peer (P2P) New concept between file sharing and transferring Generates high volume of traffic
1. Introduction � Structure of Applications Structures of applications are changing! Client-Server Traditional structure client server peer discovery, content, transfer query peer peer
Slide 8:Bursty data transfer vs. Streaming data transfer
1. Introduction � Types of Traffic Static sessions vs. Dynamic sessions packet network packet Types of traffic are various and increasing! Negotiate & allocate connect disconnect use dynamic protocol, port data connect disconnect control use static protocol, port network
Slide 9:1. Introduction � Motivation
Needs of Customers Want to get their money�s worth Fast, reliable, high-quality, secure, virus-free Internet access Needs of Service Providers Understand the behavior of their networks Provide fast, high-quality, reliable service to satisfy customers and thus reduce churn rate Plan for network deployment and expansion SLA monitoring Network security attack detection and prevention ------------------------------------------------------------------------------------------------------------------------------------------------------------- [http://http://www.caida.org/outreach/metricswg/faq.xml] CAIDA ? Outreach ? Network Measurement FAQ 2.1. Why should I measure my network's behaviour? If you don't measure it, you have no objective record or benchmark of how it behaves. This could make it difficult to judge whether changes in the network have improved its performance, or degraded it. If you are buying Internet connectivity from an ISP you need to understand the kind of service being offered, and you need to measure the actual performance so as to verify that you're getting what you pay for. ------------------------------------------------------------------------------------------------------------------------------------------------------------- [KRNET Tutorial] http://dpnm.postech.ac.kr/webboard/ Internet Traffic Monitoring & Analysis User�s Needs * Monitor the performance experienced by one�s application - Why is the web page download so slow? - Why is my multicast video stream jerky? * Check if level of service meets one�s need - Do I have enough b/w? * Check if one experiences intrusions and attacks - Is someone attacking me? Service provider�s needs * Monitor the current level of activity * Enforce SLAs(service level agreements) * Detect faults and failures * Engineer the network for better performance * Plan for future capacity * Feedback to customers ------------------------------------------------------------------------------------------------------------------------------------------------------------------------------------------------------------------------------------------------------------------------------------ [http://http://www.caida.org/outreach/metricswg/faq.xml] CAIDA ? Outreach ? Network Measurement FAQ 2.1. Why should I measure my network's behaviour? If you don't measure it, you have no objective record or benchmark of how it behaves. This could make it difficult to judge whether changes in the network have improved its performance, or degraded it. If you are buying Internet connectivity from an ISP you need to understand the kind of service being offered, and you need to measure the actual performance so as to verify that you're getting what you pay for. ------------------------------------------------------------------------------------------------------------------------------------------------------------- [KRNET Tutorial] http://dpnm.postech.ac.kr/webboard/ Internet Traffic Monitoring & Analysis User�s Needs * Monitor the performance experienced by one�s application - Why is the web page download so slow? - Why is my multicast video stream jerky? * Check if level of service meets one�s need - Do I have enough b/w? * Check if one experiences intrusions and attacks - Is someone attacking me? Service provider�s needs * Monitor the current level of activity * Enforce SLAs(service level agreements) * Detect faults and failures * Engineer the network for better performance * Plan for future capacity * Feedback to customers -----------------------------------------------------------------------------------------------------------------------
Slide 10:1. Introduction � Application Areas
Network Problem Determination and Analysis Traffic Report Generation Intrusion & Hacking Attack (e.g., DoS, DDoS) Detection Service Level Monitoring (SLM) Network Planning Usage-based Billing Customer Relationship Management (CRM) Marketing ------------------------------------------------------------------------------------------------------------------------------------------------------------- [http://http://www.caida.org/outreach/metricswg/faq.xml] CAIDA ? Outreach ? Network Measurement FAQ 2.1. Why should I measure my network's behaviour? If you don't measure it, you have no objective record or benchmark of how it behaves. This could make it difficult to judge whether changes in the network have improved its performance, or degraded it. If you are buying Internet connectivity from an ISP you need to understand the kind of service being offered, and you need to measure the actual performance so as to verify that you're getting what you pay for. ------------------------------------------------------------------------------------------------------------------------------------------------------------- [KRNET Tutorial] http://dpnm.postech.ac.kr/webboard/ Internet Traffic Monitoring & Analysis User�s Needs * Monitor the performance experienced by one�s application - Why is the web page download so slow? - Why is my multicast video stream jerky? * Check if level of service meets one�s need - Do I have enough b/w? * Check if one experiences intrusions and attacks - Is someone attacking me? Service provider�s needs * Monitor the current level of activity * Enforce SLAs(service level agreements) * Detect faults and failures * Engineer the network for better performance * Plan for future capacity * Feedback to customers ------------------------------------------------------------------------------------------------------------------------------------------------------------------------------------------------------------------------------------------------------------------------------------ [http://http://www.caida.org/outreach/metricswg/faq.xml] CAIDA ? Outreach ? Network Measurement FAQ 2.1. Why should I measure my network's behaviour? If you don't measure it, you have no objective record or benchmark of how it behaves. This could make it difficult to judge whether changes in the network have improved its performance, or degraded it. If you are buying Internet connectivity from an ISP you need to understand the kind of service being offered, and you need to measure the actual performance so as to verify that you're getting what you pay for. ------------------------------------------------------------------------------------------------------------------------------------------------------------- [KRNET Tutorial] http://dpnm.postech.ac.kr/webboard/ Internet Traffic Monitoring & Analysis User�s Needs * Monitor the performance experienced by one�s application - Why is the web page download so slow? - Why is my multicast video stream jerky? * Check if level of service meets one�s need - Do I have enough b/w? * Check if one experiences intrusions and attacks - Is someone attacking me? Service provider�s needs * Monitor the current level of activity * Enforce SLAs(service level agreements) * Detect faults and failures * Engineer the network for better performance * Plan for future capacity * Feedback to customers -----------------------------------------------------------------------------------------------------------------------
Slide 11:1. Introduction � Problems
Capturing Packets How to capture all packets from high-speed, high volume networks (Mbps?Gbps?Tbps)? Flow Generation & Storage What packet information to save to perform various analysis? How to minimize storage requirements? Analysis How to analyze and generate data needed quickly? Streaming media (Windows Media, Real, Quicktime) P2P traffic Network Security Attacks ------------------------------------------------------------------------------------------------------------------------------------------------------------- [http://http://www.caida.org/outreach/metricswg/faq.xml] CAIDA ? Outreach ? Network Measurement FAQ 2.1. Why should I measure my network's behaviour? If you don't measure it, you have no objective record or benchmark of how it behaves. This could make it difficult to judge whether changes in the network have improved its performance, or degraded it. If you are buying Internet connectivity from an ISP you need to understand the kind of service being offered, and you need to measure the actual performance so as to verify that you're getting what you pay for. ------------------------------------------------------------------------------------------------------------------------------------------------------------- [KRNET Tutorial] http://dpnm.postech.ac.kr/webboard/ Internet Traffic Monitoring & Analysis User�s Needs * Monitor the performance experienced by one�s application - Why is the web page download so slow? - Why is my multicast video stream jerky? * Check if level of service meets one�s need - Do I have enough b/w? * Check if one experiences intrusions and attacks - Is someone attacking me? Service provider�s needs * Monitor the current level of activity * Enforce SLAs(service level agreements) * Detect faults and failures * Engineer the network for better performance * Plan for future capacity * Feedback to customers ------------------------------------------------------------------------------------------------------------------------------------------------------------------------------------------------------------------------------------------------------------------------------------ [http://http://www.caida.org/outreach/metricswg/faq.xml] CAIDA ? Outreach ? Network Measurement FAQ 2.1. Why should I measure my network's behaviour? If you don't measure it, you have no objective record or benchmark of how it behaves. This could make it difficult to judge whether changes in the network have improved its performance, or degraded it. If you are buying Internet connectivity from an ISP you need to understand the kind of service being offered, and you need to measure the actual performance so as to verify that you're getting what you pay for. ------------------------------------------------------------------------------------------------------------------------------------------------------------- [KRNET Tutorial] http://dpnm.postech.ac.kr/webboard/ Internet Traffic Monitoring & Analysis User�s Needs * Monitor the performance experienced by one�s application - Why is the web page download so slow? - Why is my multicast video stream jerky? * Check if level of service meets one�s need - Do I have enough b/w? * Check if one experiences intrusions and attacks - Is someone attacking me? Service provider�s needs * Monitor the current level of activity * Enforce SLAs(service level agreements) * Detect faults and failures * Engineer the network for better performance * Plan for future capacity * Feedback to customers -----------------------------------------------------------------------------------------------------------------------
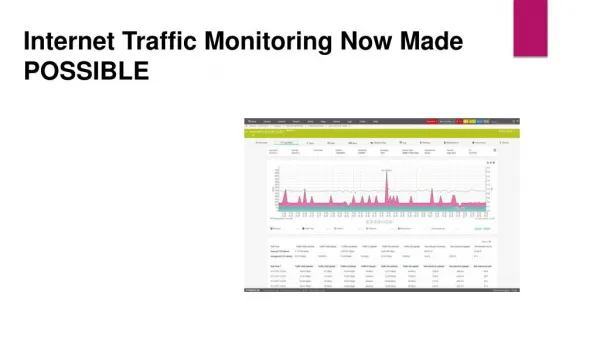
Slide 12:2. Real-World Applications - Network Usage Analysis
WAN Traffic Usage View Using MRTG At Internet Junction Time Series Data View Daily Monthly Weekly Yearly Internet Traffic Usage View
Slide 13:2. Real-World Applications - Network Planning
Network grows in complexity and increases in usage difficult to predict usage trends and loading on individual segments Previously, SNMP was the only tool available to service providers seeking access to usage statistics - severely limited For accurate network capacity planning Service providers must have access to in-depth info about their networks Network bottleneck details broken down into bandwidth used vs. bandwidth available Detailed network usage history reports A complete view of current use Analytical tools to analyze and predict usage trends
Slide 14:2. Real-World Applications - Network Weather Service (Abilene)
Abilene Network weather map of the traffic load on the core links Measurement Method: SNMP http://loadrunner.uits.iu.edu/weathermaps/abilene/ Courtesy of the Abilene Network Operations Center, Indiana University
Slide 15:2. Real-World Applications - Network Weather Service (AT&T)
Network Performance Map on AT&T backbone network http://ipnetwork.bgtmo.ip.att.net/ Measured Metrics Round Trip Delay Packet Loss Availability Measurement Method ICMP based tools Ping, Traceroute Every 30 minutes The left figure shows the latency and loss rate from Atlanta to all the other major cities in USA
Slide 16:2. Real-World Applications - SLA Monitoring
Service Level Agreement (SLA) is a contract between a network service provider and a customer that specifies, usually in measurable terms, what services the network service provider will furnish. SLA Life Cycle SLA Negotiation Using QoS Parameters SLA Implementation (provisioning) Network provisioning using QoS technology such as Diffserv, Intserv, MPLS, etc. Service configuration SLA Execution and Monitoring QoS Parameter to Network Performance Metric Mapping SLA violation handling Real-time reporting
Slide 17:2. Real-World Applications - Usage-based Billing
On a typical broadband network, 5% of the customers consume over 50% of the bandwidth. Gas Telephone Electricity Can you imagine your telephone, electricity and gas not being metered and priced by usage? What about the services provided by current NSP and ISP? Such as VPN, broadband Internet (xDSL, Cable Modem) These services are charged using a flat-fee billing model. Is this situation is reasonable?
Slide 18:2. Real-World Applications - CRM
Customer Relationship Management (CRM) is a discipline as well as a set of discrete software and technologies that focus on automating and improving the business processes associated with managing customer relationships in the areas of sales, marketing, customer service and support. Business Objectives of CRM Increased efficiency through automation The ability to provide faster response to customer inquiries Having a deeper knowledge of customer needs Generating more marketing or cross-selling opportunities Better information for better management Reduced cost of sales and increased productivity of sales representatives Receiving customer feedback that leads to new and improved products or services Traffic Monitoring for CRM basic technology to get the customer�s network usage pattern and using for target marketing
Slide 19:2. Real-World Applications - Security
Network Security Threats Reconnaissance probing or mapping the network to identify targets (e.g., ping and port scans, usually a precursor to an actual exploit attempt) Denial of Service (DoS) Attempts to consume bandwidth or computing resources in order to prevent a host communicating on the network (e.g., Smurf attacks or SYN floods) Distributed DoS (DDoS) Very similar to DoS, except that the attack originates from multiple machines Exploits Attempts to gain access to or compromise systems on the network, often seen as repeated failed login attempts Misuse Attempts to violate organizational policy (e.g., using disallowed services or including unauthorized content in e-mail or ftp transfers)
Slide 20:Code Red Worm (July 19, 2001)
A famous example of a TCP flood attack Infected over 350,000 hosts over a week The infection rate was doubling in about 37 minutes The first incarnation of the Code-Red worm (CRv1) began to infect hosts running unpatched versions of MS IIS web server on July 12th, 2001. The first version of the worm uses a static seed for it's random number generator. Then, around 10:00 UTC in the morning of July 19th, 2001, a random seed variant of the Code-Red worm (CRv2) appeared and spread. MS Windows machines were vulnerable Microsoft web servers MS Windows NT 4.0 IIS 4.0, Windows 2000 IIS 5.0 and Windows XP beta IIS 6.0 were all susceptible to the Index Server ISAPI vulnerability which could be used to take control of a server by specially formatting a web page request. The worm's original purpose was to perform a denial-of-service attack against www.whitehouse.gov.
Slide 21:Code Red Worm (July 19, 2001)
Damages Various service & network outages throughout the world The economic cost of the original Code Red worm and its more malicious cousin, Code Red II, was more than $2 Billion US, according to Computer Economics. "the most expensive virus in the history of the Internet"
Slide 22:Sapphire/Slammer Worm (Jan 25, 2003)
A famous example of an UDP flood attack Exploited a buffer overflow vulnerability in computers on the Internet running MS SQL Server or MSDE 2000 (MS Desktop Engine) Sent UDP packet (376 bytes size of very small worm) with destination UDP port 1434. No response required from the receiving machine. Spreading strategy was based on random IP scanning It selects IP addresses at random to infect, eventually finding all susceptible hosts. Infected more than 90% of vulnerable hosts in the world within 10 minutes. The worm infected at least 100,000 hosts Propagation was two orders of magnitude faster than the Code Red �The fastest spreading worm in the history of the Internet�
Slide 23:Sapphire/Slammer Worm (Jan 25, 2003)
Damages Since the worm did not contain malicious payload, it fortunately did not damage the data on the compromised machines Saturated network links causing network and service outages Caused big financial damages (hundreds of millions of dollars) to Internet-based businesses (such as Internet shopping malls, on-line paid contents services - games, movies)
Slide 24:3. POSTECH R&D Activities in Traffic Monitoring
MRTG+ WebTrafMon I WebTrafMon II NG-MON
Slide 25:MRTG+
Network link utilization monitoring, analysis & reporting system Extended Multi-Router Traffic Grapher (MRTG) added security, threshold reporting & sensitive map uses Web browser, Web server & SNMP agents generates HTML pages containing GIF images which provide a LIVE visual representation traffic based on Perl and C being used to monitor POSTECH, POSCO enterprise networks since 1997
MRTG+ ArchitectureSlide 27:MRTG+ Network Sensitive Map (1997)
Slide 28:Link Utilization Output
Slide 29:WebTrafMon
Web-based IP Network Traffic Monitoring System Developed at DPNM Lab, POSTECH In 1998, WebTrafMon I was first designed and developed to complement MRTG+ In 1999, upgrading and performance tuning of WebTrafMon I In 2000-2001, WebTrafMon II with a new architecture and a new implementation In 2002, NG-MON is being developed WebTrafMon has been deployed at the LAN-Internet junction of POSTECH campus network WebTrafMon provides comprehensive information Spatial, temporal and composition analysis Detailed analysis of traffic by minute, hour, day, month, year By protocols (network, transport, application & service)
Slide 30:WebTrafMon-I Features
Web-based User Interface Real-time and short-term analysis Packet capture with sampling (1/10, 1/100, etc.) Analysis Feature MAC Layer: Packet Size Network Layer : IP, ARP, RARP Transport Layer: TCP, UDP Application Layer: Telnet, FTP, HTTP, SMTP, DNS�
Slide 31:WebTrafMon-I Architecture
Slide 32:WebTrafMon-I User Interface
Slide 33:WebTrafMon-I Limitations
All in one system cause packet loss and response and analysis time delay analysis network interface user network traffic data packet header information analyzed information capture presentation All in a single server Long Analysis Time Response Time Delay Packet Loss
Slide 34:WebTrafMon-II Requirements
Improve the limitations of WebTrafMon-I No packet loss in probe Real-time and long-term analysis Reduced analysis and response time Distributed Load Sharing Architecture capture presentation user network interface packet header information network traffic data distributed environment
Slide 35:WebTrafMon-II Architecture
database Traffic analyzer (minutely, hourly, daily, monthly, yearly) probe network point promiscuous mode packet capture hash log format and save into DB user distributed environment request response packet header information log file log format port information port information make short term, long term traffic data minutely minutely hourly, daily, monthly, yearly statistics network traffic data analyzer Flow generator
Slide 36:WebTrafMon-II User Interface
Slide 37:WebTrafMon-II Limitations
Takes long time to analyze high-speed, high-volume traffic Takes long time to generate presentation pages Analyzer does not support multiple probes High overhead in the NFS file system Need for NG-Mon (Next Generation Monitoring) System
Slide 38:4. NG-MON
History MRTG+ (1996-97) Traffic load analysis with sensitive map WebTrafMon-I (1997-98) Traffic type analysis on a single monolithic system (up to 10 Mbps) WebTrafMon-II (1999-2001) Traffic type analysis using a distributed architecture (up to 100 Mbps) NG-MON (2002-present) Next Generation Network Traffic MONitoring and Analysis System Targeting 10 Gbps or higher networks To support various analysis applications Streaming media, multimedia conferencing, P2P, game traffic analysis Network security attack detection and analysis SLA monitoring Usage-based billing Customer relationship management
Slide 39:NG-MON - Requirements
Distributed, load-balancing architecture for scalability subdivide monitoring system into several functional components efficient load sharing between phases and within each phase pipelined and parallel architecture Lossless packet capture Flow-based analysis aggregate packet information into flows for efficient processing Support for various applications Considerations for small storage requirements To monitor high speed network such 10Gpbs link, the NG-MON should consider these 5 significant requirements. The first one, as stated, NG-MON needs distributed, load-balancing architecture. To distribute the processing load, we should divide monitoring and analysis task into several functional units, and we also need an efficient load sharing mechanism within each phase. For load distribution method, we considered the pipeline and parallel methods. The second is lossless packet capture. NG-MON should capture all packets without a loss to provide all the required information to various analysis applications. The fourth one is, to reduce processing load, flow based analysis is essential. by the flow-based analysis, NG-MON can aggregate packet information into flows for efficient processing. Also, limited storage at each phase should be considered. By the consideration of these requirements we designed the architecture of NG-MON.To monitor high speed network such 10Gpbs link, the NG-MON should consider these 5 significant requirements. The first one, as stated, NG-MON needs distributed, load-balancing architecture. To distribute the processing load, we should divide monitoring and analysis task into several functional units, and we also need an efficient load sharing mechanism within each phase. For load distribution method, we considered the pipeline and parallel methods. The second is lossless packet capture. NG-MON should capture all packets without a loss to provide all the required information to various analysis applications. The fourth one is, to reduce processing load, flow based analysis is essential. by the flow-based analysis, NG-MON can aggregate packet information into flows for efficient processing. Also, limited storage at each phase should be considered. By the consideration of these requirements we designed the architecture of NG-MON.
Slide 40:NG-MON - Design
NG-MON is composed of 5 phases Packet Capture Flow Generation Flow Store Traffic Analysis Presentation & Reporting Packet Capturer Flow Generator Flow Store Traffic Analyzer Presenter Web Server Network Device User Interface Web browser stored flows analyzed data This is an overall architecture of NG-MON design. The key feature in our design is an pipelined distribution and load balancing technique. Whole tasks are divided into 5 phases like this. Packet capture, Flow Generation, Flow Store, Traffic Analysis and Presentation phase. The entire raw packets are captured in the Packet Capture phase. And packet header information extracted from raw packets are delivered to the second phase: Flow Generation phase, The flow information is generated in this Flow Generation phase. the flow information is stored in the Flow Store phase. Traffic Analyzer queries to Flow Store and store analyzed data, provide them to Presenter. Load distribution mechanism used in each phase will be explained in the following slides in detail.This is an overall architecture of NG-MON design. The key feature in our design is an pipelined distribution and load balancing technique. Whole tasks are divided into 5 phases like this. Packet capture, Flow Generation, Flow Store, Traffic Analysis and Presentation phase. The entire raw packets are captured in the Packet Capture phase. And packet header information extracted from raw packets are delivered to the second phase: Flow Generation phase, The flow information is generated in this Flow Generation phase. the flow information is stored in the Flow Store phase. Traffic Analyzer queries to Flow Store and store analyzed data, provide them to Presenter. Load distribution mechanism used in each phase will be explained in the following slides in detail.
Slide 41:NG-MON - Packet Capture
Network Link Splitting Device divided raw packet pkt header messages Distribution of raw packets by using splitting function provided by an optical splitter by using mirroring function provided in network devices Probe captures all packets coming into probe export buffer-queues: one to one with flow generators fills buffer-queues with packet header�s 5-tuple based hashing collect the scattered packets in the same flow into the same buffer-queue This slide shows the first phase of our NG-MON design: packet capture phase. Large bulk traffic on the network links is distributed over probe systems and sent to next phase, Flow Generation. In the distribution of raw packets we can use one of these methods. First one is by using splitting function provided by an optical splitter. And Using mirroring functions provided by network devices is the second one. These probe systems captures incoming packets and extract packet header information form layered headers of each raw packet, then push into the export buffer-queues by packet header�s 5-tuple based hashing. Each probe system maintain the same number of buffer queues corresponding to the number of flow generators. If a buffer queue becomes full, probe constructs packet header messages then export to next phase. The raw packets with the same color indicates that they belong to the same flow. As you can see, packets which belong to the same flow put together into the same packet header messages. ( 5-tuple : src & dst address, protocol number, src & dst port number )This slide shows the first phase of our NG-MON design: packet capture phase. Large bulk traffic on the network links is distributed over probe systems and sent to next phase, Flow Generation. In the distribution of raw packets we can use one of these methods. First one is by using splitting function provided by an optical splitter. And Using mirroring functions provided by network devices is the second one. These probe systems captures incoming packets and extract packet header information form layered headers of each raw packet, then push into the export buffer-queues by packet header�s 5-tuple based hashing. Each probe system maintain the same number of buffer queues corresponding to the number of flow generators. If a buffer queue becomes full, probe constructs packet header messages then export to next phase. The raw packets with the same color indicates that they belong to the same flow. As you can see, packets which belong to the same flow put together into the same packet header messages. ( 5-tuple : src & dst address, protocol number, src & dst port number )
Slide 42:NG-MON - Flow Generation
Distribution of packet header information 5-tuple based hashing in the probe Packet header messages of potentially the same flow get delivered to the same flow generator Flow generator receives packet header messages and generates flows and exports flow messages to flow store pkt header messages flow messages This and next slides shows the second phases of our NG-MON design. In this phase, packet headers are compressed into flows. For the distribution of packet header information, we used 5-tuple based hashing and buffer queue for each flow generator. Therefore the packet header information of potentially the same flow get delivered to the same flow generator. There can�t be the case that same flow is generated in different flow generator at a certain moment. Flow generators simply generate flow messages from incoming packet header messages, then exports these to next phase, flow store.This and next slides shows the second phases of our NG-MON design. In this phase, packet headers are compressed into flows. For the distribution of packet header information, we used 5-tuple based hashing and buffer queue for each flow generator. Therefore the packet header information of potentially the same flow get delivered to the same flow generator. There can�t be the case that same flow is generated in different flow generator at a certain moment. Flow generators simply generate flow messages from incoming packet header messages, then exports these to next phase, flow store.
Slide 43:NG-MON - Flow Store
Separation of write operations from read operations the destination address of flow message is assigned to the flow store according to the time While one or more flow stores are inserting flow data, the other flow stores are queried by the traffic analyzers Flow store provides traffic information to support various analysis applications provides an analysis API to analyzers t 2 t 3 Database Query / Response Traffic Analyzer #1 Traffic Analyzer #2 flow messages Write operations Read operations This slide shows the third phase of our NG-MON architecture: Flow Store phase The main role of Flow Store phase is to store flow information and handle the request from analyzer: those are write operation and read operation. For the load distribution and efficient processing, we considered a method that prevent write operations from occurring with read operations at the same time in a single flow store system. In order to do this, the destination address of flow messages should be changed over to Flow Store sequentially depending on the time slot changes. While one or more flow stores are inserting flow data, the other flow stores are queried by the traffic analyzers. As you can see here, at the time slot t1, Flow Store 1 only receives flow messages and the other Flow Stores are processing queries from Analyzers. Before the time slot changes from t1 to t2, queries to Flow Store 2 should be finished. Then the time slot becomes t2, flow messages will go into the Flow Store 2, and queries to Flow Store 1 will be started. In our earlier work, we realized that one of the bottleneck of the monitoring process is a huge storage space required. So, Flow Store keeps flow information for only several time slots, and then discard them when they are finished an analysis by traffic analyzers. Therefore, flow store only requires a small and fixed amount of disk space. Flow store provides traffic information to support various analysis applications and provide an analysis API to analyzers.This slide shows the third phase of our NG-MON architecture: Flow Store phase The main role of Flow Store phase is to store flow information and handle the request from analyzer: those are write operation and read operation. For the load distribution and efficient processing, we considered a method that prevent write operations from occurring with read operations at the same time in a single flow store system. In order to do this, the destination address of flow messages should be changed over to Flow Store sequentially depending on the time slot changes. While one or more flow stores are inserting flow data, the other flow stores are queried by the traffic analyzers. As you can see here, at the time slot t1, Flow Store 1 only receives flow messages and the other Flow Stores are processing queries from Analyzers. Before the time slot changes from t1 to t2, queries to Flow Store 2 should be finished. Then the time slot becomes t2, flow messages will go into the Flow Store 2, and queries to Flow Store 1 will be started. In our earlier work, we realized that one of the bottleneck of the monitoring process is a huge storage space required. So, Flow Store keeps flow information for only several time slots, and then discard them when they are finished an analysis by traffic analyzers. Therefore, flow store only requires a small and fixed amount of disk space. Flow store provides traffic information to support various analysis applications and provide an analysis API to analyzers.
Slide 44:NG-MON - Traffic Analysis & Presentation
Analyzer extracts information from Flow Stores and can perform application specific analysis Separate analyzer is needed for each application Flow Store #1 Presenter Traffic Throughput Analyzer Usage-based billing application DDoS or DoS Attack Analyzer Other applications This slide shows the fourth and fifth phases of our NG-MON architecture. These two phases are tightly coupled according to the analysis purpose; such as Traffic Throughput Analysis, Usage-based billing analysis, DDOS and DOS attack analysis, such like that. Analyzer extracts information from Flow Stores and can perform application specific analysis. Separate analyzer is needed for each application. we separated the presenter from traffic analyzer, because more than one systems tend to be allocated in the traffic analysis phase.This slide shows the fourth and fifth phases of our NG-MON architecture. These two phases are tightly coupled according to the analysis purpose; such as Traffic Throughput Analysis, Usage-based billing analysis, DDOS and DOS attack analysis, such like that. Analyzer extracts information from Flow Stores and can perform application specific analysis. Separate analyzer is needed for each application. we separated the presenter from traffic analyzer, because more than one systems tend to be allocated in the traffic analysis phase.
Slide 45:NG-MON - Implementation
In this summer We implemented a prototype of NG-MON and deployed our system in our campus backbone network. In the implementation, we used Net Optics� Gigabit Fiber Optic tap to split the traffic and used GE Card to get it. The hardware configuration we used are, P-III 800MHz, 256 Mbytes memory, 20Gbytes HD. And we developed our system on Redhat Linux 7.2 OS. And used C language with pcap library in Packet Capture phase. In the Flow Store, we used MySQL Database to store flows. Presenter uses PHP with jpgraph library to present the analysis result through the web. In this summer We implemented a prototype of NG-MON and deployed our system in our campus backbone network. In the implementation, we used Net Optics� Gigabit Fiber Optic tap to split the traffic and used GE Card to get it. The hardware configuration we used are, P-III 800MHz, 256 Mbytes memory, 20Gbytes HD. And we developed our system on Redhat Linux 7.2 OS. And used C language with pcap library in Packet Capture phase. In the Flow Store, we used MySQL Database to store flows. Presenter uses PHP with jpgraph library to present the analysis result through the web.
Slide 46:NG-MON - Deployment at POSTECH
http://ngmon.postech.ac.kr Packet Capture Flow Generator Flow Store Analyzer Presenter 141.223.182.40 EnterFLEX at Computer Center Flow Store 141.223.182.[31,32,33,34] POSTECH Computer Center 141.223.182.38 EnterFLEX at Computer Center 141.223.182.37 EnterFLEX at Computer Center 141.223.182.36 EnterFLEX at Computer Center INTERNET 1Gbps Optical link NetOptics 1Gbps Optical Splitter Packet Capture Flow Generator Packet Capture Flow Generator Packet Capture Flow Generator POSTECH Gigabit Campus Network
Slide 47:NG-MON - Host Data Received Minute View
This and other two slides show some selected screen shots of our prototype implementation. Our analyzer shows various throughput information according to the HOST, SUBNET, and PROTOCOL. This screen shot shows the throughput of host received in one minute, and total throughput changes by the time in one hour is illustrated in the form of line graph.This and other two slides show some selected screen shots of our prototype implementation. Our analyzer shows various throughput information according to the HOST, SUBNET, and PROTOCOL. This screen shot shows the throughput of host received in one minute, and total throughput changes by the time in one hour is illustrated in the form of line graph.
Slide 48:NG-MON - Host Data Exchanged Minute View
This and other two slides show some selected screen shots of our prototype implementation. Our analyzer shows various throughput information according to the HOST, SUBNET, and PROTOCOL. This screen shot shows the throughput of host received in one minute, and total throughput changes by the time in one hour is illustrated in the form of line graph.This and other two slides show some selected screen shots of our prototype implementation. Our analyzer shows various throughput information according to the HOST, SUBNET, and PROTOCOL. This screen shot shows the throughput of host received in one minute, and total throughput changes by the time in one hour is illustrated in the form of line graph.
Slide 49:NG-MON - Detailed Subnet Data Sent Minute View
This is a detailed subnet data sent view in a certain minute.This is a detailed subnet data sent view in a certain minute.
Slide 50:NG-MON - Application Protocol Minute View
Left one is an application protocol view in a certain minute. And right one is Time series graph of the throughput at each protocol layer during a certain hour.Left one is an application protocol view in a certain minute. And right one is Time series graph of the throughput at each protocol layer during a certain hour.
Slide 51:NG-MON - Time Series Minute View
Left one is an application protocol view in a certain minute. And right one is Time series graph of the throughput at each protocol layer during a certain hour.Left one is an application protocol view in a certain minute. And right one is Time series graph of the throughput at each protocol layer during a certain hour.
Slide 52:5. Summary
Internet is continuously growing in terms of: # of users & hosts, traffic loads & types ISPs and enterprises need to monitor their networks for various purposes (e.g., Problem Detection, Workload Characterization, Planning, SLA, Billing, Security, CRM) This talk introduced monitoring approaches, flow generation and analysis methods, tools, R&D/standards activities, NG-MON, and real-world applications NG-MON Scalable and cost-effective architecture Spatial, temporal, composition analysis P2P, multimedia service, game traffic analysis Network security attack analysis Network monitoring and analysis is essential for service providers and enterprise network administrators but it is not easy and still needs a lot of work to do it right!
Slide 53:NG-Mon Demo
http://ngmon.postech.ac.kr