Download

1 / 30
480 likes | 1.74k Views
Cohort Studies. Principles of Epidemiology Lecture 9 Dona Schneider, PhD, MPH, FACE. Cohort Studies. Type of Analytic study Unit of observation and analysis: Individual (not group)

E N D
Cohort Studies Principles of Epidemiology Lecture 9 Dona Schneider, PhD, MPH, FACE
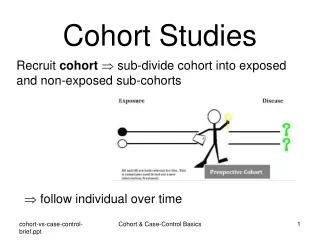
Cohort Studies • Type of Analytic study • Unit of observation and analysis: Individual (not group) • Also called follow-up studies, incidence studies, panel studies, longitudinal studies, or prospective studies
Assembling a Cohort • Cohorts may be chosen because they represent • The general population (i.e., the outcome of interest has a high incidence rate) • Special exposure groups (e.g., smokers, uranium miners or asbestos workers with high levels of specific exposures) • Special resource groups (e.g., alumni, physicians, nurses) • Geographically or facility-defined groups (e.g., Three Mile Island, hospitals with specialized maternity care)
Design • At baseline (1st observation point): • Subjects are all disease free • Exposure is used to classify subjects into exposed or unexposed groups • Subjects are followed to document incidence (2nd observation point)
Assembling the Cohort • Before beginning the study, determine who is susceptible and who is immune to the outcome of interest • You may need to do this with diagnostic tests or medical histories
Single Sample Cohort Study Design TIME Diseased Disease-Free Cohort Exposed Not Diseased Target Population Diseased Not Exposed Not Diseased
The Framingham Study • Since 1948, samples of residents of Framingham, Massachusetts, have been subjects of investigations of risk factors in relation to the occurrence of heart disease and other outcomes
The Framingham Study • Hypotheses: • Persons with hypertension develop CHD at a greater rate than those who are normotensive. • Elevated blood cholesterol levels are associated with an increased risk of CHD. • Tobacco smoking and habitual use of alcohol are associated with an increased incidence of CHD. • Increased physical activity is associated with a decrease in development of CHD. • An increase in body weight predisposes a person to CHD.
The Framingham Study • Study population consisted of 5,127 men and women between ages 30 and 62 years and were at the time of entry free of cardiovascular disease (1948-1952) • Cohort was examined every 2 years and by daily surveillance of hospitalizations at Framingham Hospital
The Framingham Study • Exposures included: • Smoking • Alcohol use • Obesity • Elevated blood pressure • Elevated cholesterol levels • Low levels of physical activity, etc.
Comparison (Control) Groups • With a one-sample (population-based) cohort, exposure is unknown until after the first period of observation • Example: • Select the cohort (all residents of Framingham) • All members of the cohort are given questionnaires, and/or clinical examinations, and/or testing to determine exposure status • The cohort is then divided into exposure categories based on those results • The nonexposed become the internal controls • For continuous variables, such as caloric intake or amount of exercise, multiple levels of exposure are constructed • It is common to break exposure into quantiles (equally ordered subgroups) and to use the extremes as the comparison (referent) group
Question How does the design of a cohort study change if everybody in the cohort is exposed (special exposure cohort)? Example: All persons exposed to radiation from the Chernobyl accident.
Answer • You need to select a separate control cohort people as similar as possible to the exposed cohort (income, age, gender, employment) but with no exposure • If you cannot find a comparison group, you may use available population incidence rates under certain circumstances
Multi-Sample Cohort Study Design TIME Diseased Study Cohort Exposed Not Diseased Diseased Control Cohort Not Exposed Not Diseased
Selecting Comparison (Control) Groups • If the cohort is the general population, subjects are selected based on exposure and the comparison group is internal - from the same sample - who do not have the exposure • If the cohort is based on a high risk population selected on the basis of a given exposure (e.g., Chernobyl residents, asbestos workers), external controls must be sought • Sometimes both comparison groups are sought • This eliminates the healthy worker effect and confounding for etiologic agents other than the exposure of interest
Selecting Comparison Groups (cont.) • If a comparison group cannot be assembled, known population rates for outcomes may be acceptable but only if they are adjusted for the exposure • Lung cancer rates are based on the population but should not be used for comparison to compare to populations with high smoking rates, such as miners. WHY? • Leukemia rates from the general population can be used to compare rates to Three Mile Island residents. WHY?
Determining Exposure • Valid means of determining exposure include: • Questionnaires • Laboratory tests • Physical measurements • Special procedures • Medical records • What if the exposure is chronic, such as radon or smoking?
Measuring Disease • You must determine endpoints in a similar manner for both the exposed and the non-exposed • That is, procedures for disease identification must be the same for the exposed and the non-exposed • Define the outcomes of interest (set diagnostic criteria) • If you are looking for multiple outcomes, each must be defined
Measuring Disease (cont.) • Mortality may be ascertained from medical records, autopsy records, death certificates, physician records, or next-of-kin • Using mortality records does not allow for multiple outcomes • Hospital records can be scanned for specific types of admissions • Health records of employers and schools can be monitored • Reportable diseases may be ascertained from state registries • Absenteeism may be monitored with work records, self reporting, school records or household surveys • Common ailments that do not usually require medical care may be monitored through self-reports, telephone surveys or calendar sheets
Relative Risk (RR) • A ratio that measures the risk of disease among the exposed to the risk among the unexposed • RR Numerator: Incidence rate in the exposed • RR Denominator: Incidence rate in the unexposed
Example: Calculating the Relative Risk Disease Status CHD cases (Cases) No CHD (Controls) TOTAL Exposure Status Smoker 112 176 288 Non-smoker 88 224 312 A/(A+B) 112 / 288 Relative Risk = = = 1.38 B/(C+D) 88 / 312
Relative Risk = 1.38 Example: Interpreting the Relative Risk The risk of developing CHD is 1.38 times higher for a smoker than for a nonsmoker. or The risk of developing CHD is 38% higher for a smoker than for a nonsmoker.
RR<1 RR=1 RR>1 Risk comparison between exposed and unexposed Risk for disease is lower in the exposed than in the unexposed Risk of disease is equal for exposed and unexposed Risk for disease is higher in the exposed than in the unexposed Exposure as a risk factor for the disease? Particular exposure is not a risk factor Exposure increases disease risk(Risk factor) Exposure reduces disease risk (Protectivefactor)
Types of Cohort Studies • Prospective • Exposure baseline in the present • Follow-up period: present to future • Retrospective: • Exposure baseline in the past • Follow-up period: past to present • Historical prospective or ambispective: • Exposure baseline in the past • Follow-up period: past to present to future
Cohort study data collection (pg. 221) DESIGN PAST PRESENT FUTURE Prospective E D Retrospective E D Historical prospective E E D
Types of Cohort Studies (cont.) • You may also NEST a case-control study within a cohort study Example: • Begin with a cohort of 10,000 individuals without rheumatoid arthritis • Test for the presence of RA antigen • Assume those with RA antigen are the exposed and those without the controls • Follow for 10 years and determine the incidence of disease among both cohorts • This reduces the cost of testing
Outcome Measures • Incidence in the exposed • Incidence in the unexposed • Relative risk • Attributable risk (risk difference) • Population attributable risk • Attributable risk percent • Population attributable risk percent • Standardized mortality ratio
Advantages of Cohort Studies • Temporality: Exposure precedes outcome because the cohort is disease free at baseline • Efficient for studying rare exposures • May be used to study multiple outcomes • Allows for calculation of incidence of diseases in exposed and unexposed individuals • Minimizes recall bias
Disadvantages of Cohort Studies • Tend to be expensive (large sample size) and time consuming (long follow-up period) • Loss to follow-up • When multiple outcomes or specific disease incidence is the outcome of interest, bias can be a serious problem • Inefficient to study rare diseases
Disadvantages of Cohort Studies (cont.) • Nonparticipation (selection bias) – it cannot be assumed that those who chose to participate had the same prevalence of exposures nor incidence of disease as those who did not participate • A difference in prevalence of exposure in nonparticipants will not bias the results • A difference in rate of disease among nonparticipants will bias the results