Download
1 / 12
120 likes | 200 Views
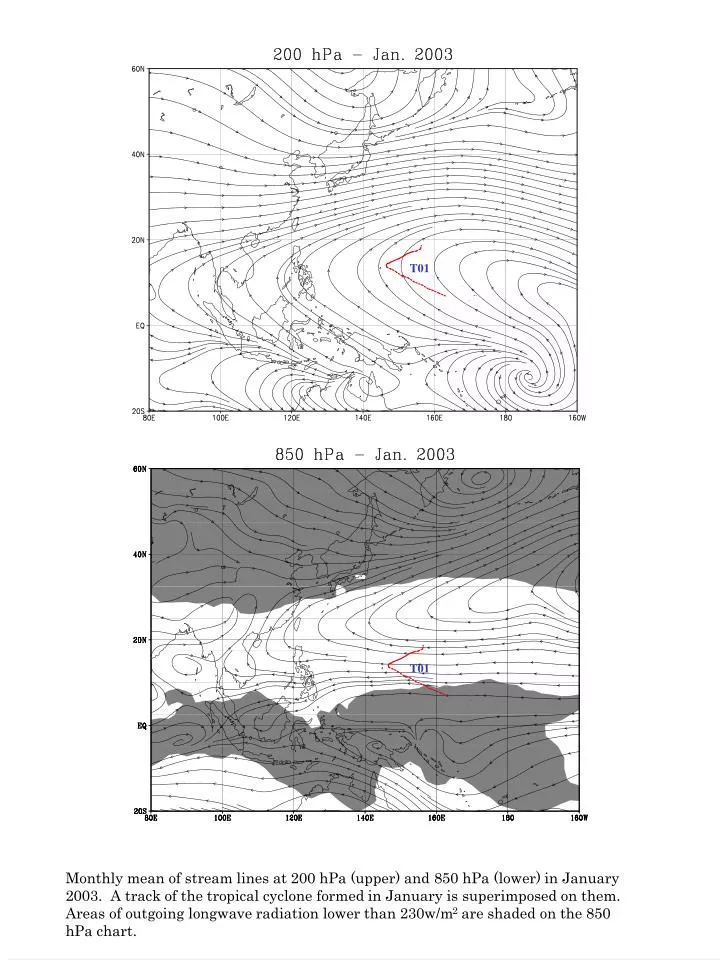
T01. T01. Monthly mean of stream lines at 200 hPa (upper) and 850 hPa (lower) in January 2003. A track of the tropical cyclone formed in January is superimposed on them. Areas of outgoing longwave radiation lower than 230w/m 2 are shaded on the 850 hPa chart.

E N D
T01 T01 Monthly mean of stream lines at 200 hPa (upper) and 850 hPa (lower) in January 2003. A track of the tropical cyclone formed in January is superimposed on them. Areas of outgoing longwave radiation lower than 230w/m2 are shaded on the 850 hPa chart.
Monthly mean of stream lines at 200 hPa (upper) and 850 hPa (lower) in February 2003. A track of the tropical cyclone formed in January is superimposed on them. Areas of outgoing longwave radiation lower than 230w/m2 are shaded on the 850 hPa chart.
Monthly mean of stream lines at 200 hPa (upper) and 850 hPa (lower) in March 2003. A track of the tropical cyclone formed in January is superimposed on them. Areas of outgoing longwave radiation lower than 230w/m2 are shaded on the 850 hPa chart.
T02 T02 Monthly mean of stream lines at 200 hPa (upper) and 850 hPa (lower) in April 2003. A track of the tropical cyclone formed in January is superimposed on them. Areas of outgoing longwave radiation lower than 230w/m2 are shaded on the 850 hPa chart.
T03 T04 T03 T04 Monthly mean of stream lines at 200 hPa (upper) and 850 hPa (lower) in May 2003. A track of the tropical cyclone formed in January is superimposed on them. Areas of outgoing longwave radiation lower than 230w/m2 are shaded on the 850 hPa chart.
T06 T05 T06 T05 Monthly mean of stream lines at 200 hPa (upper) and 850 hPa (lower) in June 2003. A track of the tropical cyclone formed in January is superimposed on them. Areas of outgoing longwave radiation lower than 230w/m2 are shaded on the 850 hPa chart.
T07 T08 T07 T08 Monthly mean of stream lines at 200 hPa (upper) and 850 hPa (lower) in July 2003. A track of the tropical cyclone formed in January is superimposed on them. Areas of outgoing longwave radiation lower than 230w/m2 are shaded on the 850 hPa chart.
T10 T11 T09 T13 T12 T10 T11 T09 T13 T12 Monthly mean of stream lines at 200 hPa (upper) and 850 hPa (lower) in August 2003. A track of the tropical cyclone formed in January is superimposed on them. Areas of outgoing longwave radiation lower than 230w/m2 are shaded on the 850 hPa chart.
T16 T15 T14 T14 T15 T16 Monthly mean of stream lines at 200 hPa (upper) and 850 hPa (lower) in September 2003. A track of the tropical cyclone formed in January is superimposed on them. Areas of outgoing longwave radiation lower than 230w/m2 are shaded on the 850 hPa chart.
T17 T18 T19 T17 T19 T18 Monthly mean of stream lines at 200 hPa (upper) and 850 hPa (lower) in October 2003. A track of the tropical cyclone formed in January is superimposed on them. Areas of outgoing longwave radiation lower than 230w/m2 are shaded on the 850 hPa chart.
T21 T20 T21 T20 Monthly mean of stream lines at 200 hPa (upper) and 850 hPa (lower) in November 2003. A track of the tropical cyclone formed in January is superimposed on them. Areas of outgoing longwave radiation lower than 230w/m2 are shaded on the 850 hPa chart.
Monthly mean of stream lines at 200 hPa (upper) and 850 hPa (lower) in December 2003. A track of the tropical cyclone formed in January is superimposed on them. Areas of outgoing longwave radiation lower than 230w/m2 are shaded on the 850 hPa chart.