Download
1 / 55
550 likes | 553 Views
This study explores the effects of climate variability and change on the Columbia River Basin, focusing on hydroclimatology, precipitation, snowmelt, streamflows, and flood risks. It also discusses the influence of Pacific Decadal Oscillation and El Niño Southern Oscillation on the summer streamflows of the Columbia River.

E N D
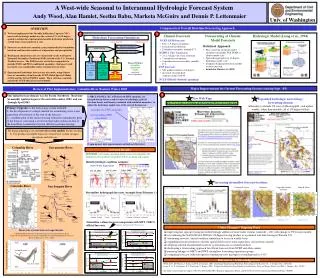
Effects of Climate Variability and Change on the Columbia River Basin Alan F. Hamlet Philip W. Mote Dennis P. Lettenmaier JISAO/CSES Climate Impacts Group Dept. of Civil and Environmental Engineering University of Washington
Annual PNW Precipitation (mm) Elevation (m) The Dalles
(mm) Summer Precipitation Winter Precipitation
Sensitivity of Snowmelt and Transient Rivers to Changes in Temperature and Precipitation • Temperature warms, • precipitation unaltered: • Streamflow timing is altered • Annual volume stays about the same • Precipitation increases, • temperature unaltered: • Streamflow timing stays about the same • Annual volume is altered
Pacific Decadal Oscillation El Niño Southern Oscillation A history of the PDO A history of ENSO warm warm cool 1900 1910 1920 1930 1940 1950 1960 1970 1980 1990 2000 1900 1910 1920 1930 1940 1950 1960 1970 1980 1990 2000
Effects of the PDO and ENSO on Columbia River Summer Streamflows PDO Cool Cool Warm Warm high high low low Ocean Productivity
Long-Term Trends in Temperature, Precipitation, and Streamflow
Trends in Annual Streamflow at The Dalles from 1858-1998 are strongly downward.
The Dust Bowl was probably not the worst drought sequence in the past 250 years red = observed, blue = reconstructed Source: Gedalof, Z., D.L. Peterson and Nathan J. Mantua. (in review). Columbia River Flow and Drought Since 1750. Submitted to Journal of the American Water Resources Association.
Precip Canada Tmax USA PNW CA GB CRB Tmin
A Time Series of Temporally Smoothed, Regionally Averaged Met Data for the West
Tmax Tmin
PNW GB CA CRB Schematic of VIC Hydrologic Model and Energy Balance Snow Model Snow Model
Trends in April 1 SWE 1950-1997 Mote P.W.,Hamlet A.F., Clark M.P., Lettenmaier D.P., 2005, Declining mountain snowpack in western North America, BAMS (in press)
Overall Trends in April 1 SWE from 1947-2003 DJF avg T (C) Trend %/yr Trend %/yr
Temperature Related Trends in April 1 SWE from 1947-2003 DJF avg T (C) Trend %/yr Trend %/yr
Precipitation Related Trends in April 1 SWE from 1947-2003 DJF avg T (C) Trend %/yr Trend %/yr
Trends in timing of peak snowpack are towards earlier calendar dates Change in Date
As the West warms, spring flows rise and summer flows drop Stewart IT, Cayan DR, Dettinger MD, 2005: Changes toward earlier streamflow timing across western North America, J. Climate, 18 (8): 1136-1155
Trends in simulated fraction of annual runoff in each month from 1947-2003 (cells > 50 mm of SWE on April 1) June March Relative Trend (% per year)
Trends in March Runoff Trends in June Runoff DJF Temp (°C) DJF Temp (°C) Trend %/yr Trend %/yr
Flood risks have increased in many coastal areas with warm winter temperatures, whereas colder inland areas show decreases in flood risk. Simulated Changes in the 20-year Flood Associated with 20th Century Warming DJF Avg Temp (C) X20 2003 / X20 1915 X20 2003 / X20 1915
Regionally Averaged Cool Season Precipitation Anomalies PRECIP
20-year Flood for “1973-2003” Compared to “1916-2003” for a Constant Late 20th Century Temperature Regime DJF Avg Temp (C) X20 ’73-’03 / X20 ’16-’03 X20 ’73-’03 / X20 ’16-’03
Global Climate Change Scenarios and Hydrologic Impacts for the PNW
Natural AND human influences explain the observations best. Natural Climate Influence Human Climate Influence All Climate Influences
+3.2°C °C +1.7°C +0.7°C 1.2-5.5°C 0.9-2.4°C Observed 20th century variability 0.4-1.0°C Pacific Northwest
% -1 to +3% +6% +2% +1% Observed 20th century variability -2 to +21% -1 to +9% Pacific Northwest
Four Delta Method Climate Change Scenarios for the PNW ~ + 2.25 C ~ + 1.7 C Somewhat wetter winters and perhaps somewhat dryer summers
Changes in Mean Temperature and Precipitation or Bias Corrected Output from GCMs ColSim Reservoir Model VIC Hydrology Model
The warmest locations are most sensitive to warming +2.3C, +4.5% winter precip
Changes in Simulated April 1 Snowpack for the Canadian and U.S. portions of the Columbia River basin (% change relative to current climate) Current Climate “2020s” (+1.7 C) “2040s” (+ 2.25 C) -3.6% -11.5% -21.4% -34.8% April 1 SWE (mm)
Naturalized Flow for Historic and Global Warming Scenarios Compared to Effects of Regulation at 1990 Level Development Historic Naturalized Flow Estimated Range of Naturalized Flow With 2040’s Warming Regulated Flow
Frequency of Drought in the Columbia River Comparable to Water Year 1992 (data from 1962-1997) x 4.7 x 2 x 1.3 x 1.3
Will Global Warming be “Warm and Wet” or “Warm and Dry”? Answer: Probably BOTH!
Impacts on Columbia Basin hydropower supplies • Winter and Spring: increased generation • Summer: decreased generation • Annual: total production will depend primarily on annual precipitation (+2C, +6%) (+2.3C, +5%) (+2.9C, -4%) NWPCC (2005)
Warming climate impacts on electricity demand • Reductions in winter heating demand • Small increases in summer air conditioning demand in the warmest parts of the region NWPCC 2005
Managed Flow Augmentation • The flow needed to provide acceptable flow velocity for juvenile transport is frequently higher than natural flow, particularly in late summer (I.e. use of storage is required). Climate change increases the amount of storage required to meet flow targets. • Currently very little storage is allocated to fish in comparison with hydropower. • In a conflict between hydro or irrigation and fish flow, the current reservoir operating policies are designed to protect hydro and irrigation (fish flow storage allocation for main stem and Snake River flow targets is at the top of a shared reservoir storage pool) • The Columbia River Treaty does not provide explicitly for summer flow in the U.S. (transboundary issues). Compare with guaranteed winter releases associated with flood control. Hydro storage Fish flow storage
Adaptation to climate change will require complex tradeoffs between ecosystem protection and hydropower operations Source: Payne, J.T., A.W. Wood, A.F. Hamlet, R.N. Palmer, and D.P. Lettenmaier, 2004, Mitigating the effects of climate change on the water resources of the Columbia River basin, Climatic Change, Vol. 62, Issue 1-3, 233-256
Flood Control vs. Refill Maintaining an appropriate balance between flood protection and the reliability of reservoir refill is crucial to many water resources objectives in the Columbia Basin. As streamflow timing shifts move peak flows earlier in the year, flood evacuation schedules may need to be revised both to protect against early season flooding and to begin refill earlier to capture the (smaller) spring freshet. Model experiments (see Payne et al. 2004) have shown that moving flood evacuation two weeks to one month earlier in the year helps mitigate reductions in refill reliability associated with streamflow timing shifts. Payne, J.T., A.W. Wood, A.F. Hamlet, R.N. Palmer, and D.P. Lettenmaier, 2004, Mitigating the effects of climate change on the water resources of the Columbia River basin, Climatic Change, Vol. 62, Issue 1-3, 233-256
Flood Control vs. Refill : Current Climate Full
Flood Control vs. Refill : Current Climate : + 2.25 oC No adaption Streamflow timing shifts can reduce the reliability of reservoir refill + 2.25 oC Full