Download
1 / 75
750 likes | 824 Views
Trends in Amazon land change. Gilberto Câmara National Institute for Space Research Brazil http :// www.dpi.inpe.br / gilberto. Where is the food coming from and going to?. graphics: The Economist. Nature, 29 July 2010. Nature, 29 July 2010.

E N D
Trends in Amazon land change Gilberto Câmara NationalInstitute for Space Research Brazil http://www.dpi.inpe.br/gilberto
Where is the food coming from and going to? graphics: The Economist
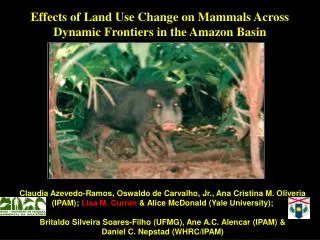
Nature, 29 July 2010 Brazil is the world’s current largest experiment on land change and its effects: will it also happen elsewhere? Today’s questions about Brazil could be tomorrow’s questions for other countries
T1 – Selective logging T2 – Loss of smaller trees T3 – Loss >50% of forest T4 – Loss >90% of forest How does deforestation happen?
Final = Clearcut Pasture
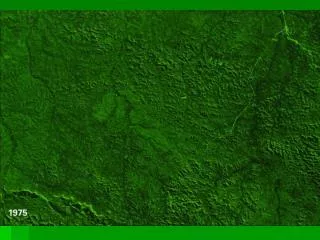
Frentes de desmatamento 91-96 Dalves (2000)
INPE’s Monitoring Systems dialydeforestationalerts time Yearly rates ofclearcuts Floresta
Real-time Deforestation Monitoring Daily warnings of newly deforested large areas
Keep watching! Jan-April/2011: 126% increase
How much it takes to survey Amazonia? 116-112 30 Tb of data 500.000 lines of code 150 man/years of software dev 200 man/years of interpreters 116-113 166-112
Finding: Transparency builds governance! CBERS image Deforestation Degradation Science (27 April 2007): “Brazil´s monitoring system is the envy of the world”.
Finding: Deforestation is becoming harder to detect Proportionofclearcutsbysize (ha) Clearingslessthan 50 ha: 35% of total in 2002 to80% of total in 2010
Finding: Command and control actions are effective means to curb deforestation Almostalldeforestationisillegal
“By 2020, Brazil will reduce deforestation by 80% relative to 2005.” (pres. Lula in Copenhagen COP-15)
Transparency builds governance! Deforestation in Brazilian Amazonia (1988-2011) dropped from 27,000 km2 to 6,200 km2
“Deforestation in the Brazilian Amazon is down by a whopping 78% from its recent high in 2004. If Brazil can maintain that progress, it would be the biggest environmental success story in decades, and would set an example to other countries that want to protect their tropical forests.” (Editorial, 7 June 2012)
Prices or policies? Deforestation Slowdown in the Legal Amazon: Prices or Policies? http://www. climatepolicyinitiative.org
Prices or policies? “Our analysis shows that approximately half of the deforestation that was avoided in the Amazon in the 2005 through 2009 period can be attributed to conservation policies introduced in the second half of the 2000s. This is equivalent to an avoided loss of 62,000 km2 of forest area, or approximately 620 million tons of stored C (2.3 billion tons of stored CO2), which our estimates value at US$ 11.5 billion US dollars.” (Pinho et al., 2012) Deforestation Slowdown in the Legal Amazon: Prices or Policies? http://www. climatepolicyinitiative.org
What happened with 720.000 km2 deforested? Firstmapofland use andland cover ofAmazonia
What happened with 720.000 km2 deforested? TerraClass - firstmapofland use andland cover ofAmazonia
Nível inédito de detalhe espacial: 20 m (CBERS) e 30 m (LANDSAT) Pasto limpo