Download
1 / 32
320 likes | 418 Views
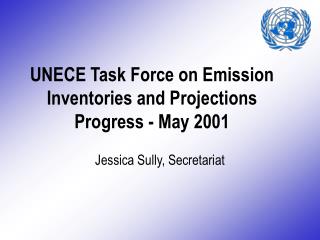
MINISTERIO DE MEDIO AMBIENTE. DIRECCIÓN GENERAL DE CALIDAD Y EVALUACIÓN AMBIENTAL. WORK UNDER AGREEMENT BETWEEN THE SPAIN’S ENVIRONMENT MINISTRY AND THE TECHNICAL UNIVERSITY OF MADRID. SPAIN’S EMISSION PROJECTIONS (SEP) PROJECT. Dr. Julio Lumbreras jlumbreras@etsii.upm.es.

E N D
MINISTERIO DE MEDIO AMBIENTE. DIRECCIÓN GENERAL DE CALIDAD Y EVALUACIÓN AMBIENTAL WORK UNDER AGREEMENT BETWEEN THE SPAIN’S ENVIRONMENT MINISTRY AND THE TECHNICAL UNIVERSITY OF MADRID SPAIN’S EMISSION PROJECTIONS (SEP) PROJECT Dr. Julio Lumbreras jlumbreras@etsii.upm.es Thessaloniki, 30th October 2006
OUTLINE 1 - METHODOLOGY • 1.1. Aim of the project • 1.2. Activities • 1.3 Pollutants • 1.4. Projection methodology • 1.5. EmiPro • 1.6. Update system • 2.1. Ex-post evaluation • 2.2. RAINS comparison • 2.3. National Emission Ceilings achievement • 3. CONCLUSIONS 2 - RESULTS
1.1.- The aim of the project Objectives • To develop a consistent methodology to evaluate Spain’s Emission Projections • To obtain the emission projections for the period 2001 – 2020 Critical aspects • A tool for decision making process • Projection Vs. Prediction • - Activity projection vs. sectoral prospective • Integration of sectoral studies and activity projections • Full consistency with the National Atmospheric Emission Inventory (NEI) • Basis for national AQ modelling
1.2.- Activities Every activity under NEI using SNAP-97 nomenclature
1.3.- Pollutants Geneva Convention Sulphur oxides (SO2+SO3), measured as mass of SO2 Nitrogen oxides (NO+NO2), measured as mass of NO2 Ammonia (NH3) Volatile organic compounds (except methane) (NMVOC) Carbon monoxide (CO) Particulate Matter (as TSP, PM10 and PM2,5) Heavy metals: lead (Pb), cadmium (Cd) and mercury (Hg) Kyoto Protocol Carbon dioxide (CO2) Methane (CH4) Nitrous oxide (N2O) Perfluorocarbons (PFCs) Hydrofluorocarbons (HFCs) Sulphur hexafluoride (SF6) As mass of each individual compound In CO2 equivalent weighted according to its global warming potential
1.4.- Methodology - The projections are developed under EEA and US EPA framework • The usual projection level is national (SNAP activity) and in annual basis. • Macroeconomic variables are exogenous to the model • Projections are specifically calculated for each pollutant included in the activities considered. • Projections are associated to scenarios: • Starting considerations: • Technological • Socioeconomic • Statistical • Legislative • Hypothesis: • Activity rates • Emission factors • Emission trends = SCENARIO
Business as usual: statistical methods are used to provide future emissions, activity rates and/or emission factors. The only information used are past data without taking into account possible effect of measures. It is a “reference” scenario and it has physical constrains. Equivalent to “without measures”. • Base: it includes every plan, policy or measure officially adopted that has any effect in atmospheric emissions. Equivalent to “with measures”. • Target: it incorporates additional measures aimed at achieving the targets included in both National Emissions Ceilings Directive and Kyoto Protocol. Equivalent to “with additional measures”. NOX, SO2, COVNM, NH3 NEC 2010 1990 2000 Year Kyoto CO2 equivalent 2010 1990 2000 Year Scenarios
Results Below threshold? Kyoto Protocol NEC Method for calculation Evaluated emissions Basic information Emission data (Inventory) Socioeconomic data Sectoral studies Legislation Technological aspects Target Hypotheses First Hypotheses - Activity Rate (A) - Emission factor (EF) - Emission (E) - Control & Growth Factors (CF & GF) - Activity Rate trend (A) - Emission factor trend (EF) - Emission trend (E) - Control Factor (CF) and Growth Factor (G) NO YES CONCLUSIONS Definition of a Target scenario SCENARIOS Base BAU SCENARIO Target
Consistency criteria AR = activity rate SNAP 1 SNAP 2 SNAP ... AR 1 Σ Proj Group of related activities Hypothesis homogenization Proj 1 AR 2 Projection estimation Proj 2 Relationships, implications Macroscenario Proj ... Integration criteria • Development of ‘macroscenarios’ for coherence assurance • Once the relationship mapping has been clearly identified, it is only a matter of introducing consistency conditions into the hypothesis made under each scenario for a particular activity rate
1.5.- EmiPro • EmiPro (Emission Projections) is a software tool specifically developed to handle all the data and procedures involved in the SEP project. Last non-Beta version, currently v4.0 - Start screen -
Design issues • Generally, projections are made on national basis • But, the setting of thresholds derived from NEC Directive’s commitments must be done taking into account only a subset of the total national emissions Solution: • Implementation of a parallel database system inside EmiPro corresponding to the two different geographic and pollutant scopes. None of them stores NUTS-3 level information:
SEP (1990-2000) Activity-rate historical datasets analysis and geographical disaggregation criteria CORINAIR DB 2004 General NEC-Base Results • General: • National scope • All SEP’s project pollutants EmiPro (1990-2020) General NEC - Parallel projection scheme and information stored in each database • NEC-Base: • Only NMVOC, NH3, NOX and SO2 • SNAP 11 (nature) emissions are excluded • NMVOC from SNAP 10 (agriculture) are excluded • Emissions under the EMEP domain (Canary Islands are not included) • Domestic and international cruise traffic (h > 1000 m) emissions are excluded • National and international airport traffic (LTO cycles<1000m) are included
Main functionalities Storage and recovery of past (history) emissions
Main functionalities Generation of projections from history data and algorithm factors
Main functionalities Storage and recovery of projected emissions
Main functionalities Reports generation
Main functionalities Quality Assurance/Quality Check
1.6.- Updating system Projections 2001-2020 (NEI series 1990-year i-3) year i Updated NEI (series 1990-year i-2) Inclusion of new policies and measures 9-month delay Publication of new methodology (series 1990-year i-2) Projection update (NEI series 1990-year i-2) year i+1 Updated NEI (series 1990-year i-1) Inclusion of new policies and measures
Conclusions from updating system • It is not possible to obtain consistent emission projections until 9 months after NEI publication • New policies and measures are included into emission projections as they appear vs. NEI annual updates Other updates • Base year intended to be changed every 5 years • Temporal scope is extended, if necessary, when the base year is updated • Historical data up to new base year are included • Previous projected series are kept
OUTLINE 1 - METHODOLOGY • 1.1. Aim of the project • 1.2. Activities • 1.3 Pollutants • 1.4. Projection methodology • 1.5. EmiPro • 1.6. Update system • 2.1. Ex-post evaluation • 2.2. RAINS comparison • 2.3. National Emission Ceilings achievement • 3. CONCLUSIONS 2 - RESULTS
2.1.- Ex-post evaluation • Each 2 years: • Projection values are checked against official NEI estimates • Comparison at group and national level • Deviation analysis: • due to trend estimation (non-updated NEI) (a) • due to methodological issues (updated NEI) (b) Ex-post evaluation for NH3 emissions Ex-post evaluation for GHG emissions (a)
(b) Ex-post evaluation for total VOC emissions* * Provisional data
2.2.- RAINS comparison • Development of a 4-level hierarchy nomenclature (sub-SNAP = SEP) • Mapping RAINS-SEP (biunivocal correspondence) • Comparisons: • Activity rate • Technology penetration and emission factors • NEC emissions Fuel = F Technology =T Reduction measure =M 01/01/01/01 SNAP PP_EX_OTH-BC1-NOC SEP Power Plant (SNAP) Existing (T) Other boiler type (T) Brown Coal (F) No Control Measure (M)
2.3.- NEC accomplishment NH3 Emissions* * Provisional data
VOC Emissions* * Provisional data
NOx Emissions* * Provisional data
SOx Emissions* * Provisional data
Drivers’ comparison • Most of the drivers were underestimated • SEP and IIASA estimates show a reasonable agreement * Total National ** Data from 2004
3.- Conclusions • Spain has a consistent methodology to evaluate emission projections • A tailored software tool (EmiPro) supports data management, quality checks and report generation • A specific nomenclature (SEP) has been developed with a SEP-RAINS mapping (open for comments) • Spain’s projections have been compared against RAINS/GAINS results using this mapping • SEP and RAINS emission trends are very similar • Difficulties in the achievement of the ceilings for 2010 could be partly explained by unrealistic estimation of drivers trends when negotiating Spain’s emission ceilings