Download
1 / 23
230 likes | 291 Views
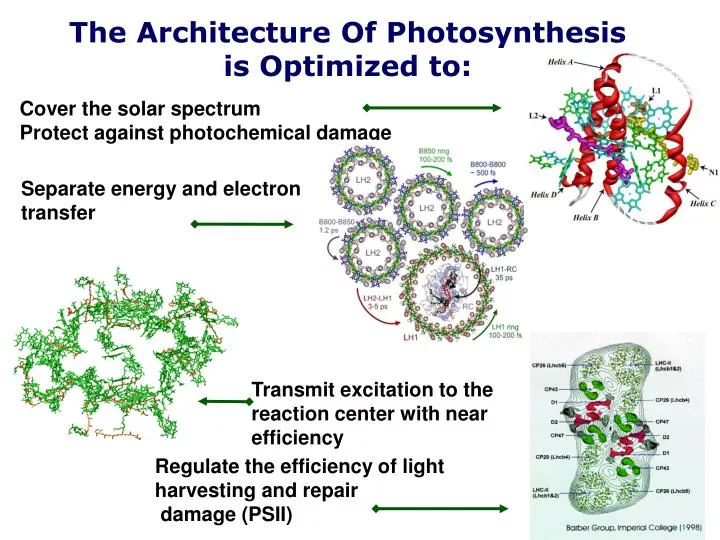
The Architecture Of Photosynthesis is Optimized to:. Cover the solar spectrum Protect against photochemical damage. Separate energy and electron transfer. Transmit excitation to the reaction center with near efficiency. Regulate the efficiency of light harvesting and repair

E N D
The Architecture Of Photosynthesis is Optimized to: Cover the solar spectrum Protect against photochemical damage Separate energy and electron transfer Transmit excitation to the reaction center with near efficiency Regulate the efficiency of light harvesting and repair damage (PSII)
An Abstract Question: How much Chl is in Picasso’s tree ? A Collection of Facts A “medium” size tree has ~ 100,000 leaves An “average” leaf has a surface area of ~ 2.8 x 10⁻³ m2 The “average” Chl content of a C3 leaf is ~ 5.6 x 10⁻⁴ mol m-2 The molecular weight of Chl a is 894 g/ mol A Pragmatic Answer: 140 g Chl / tree Pablo Picasso – House and Trees Paris, Winter 1908 http://www.hipernet.ufsc.br/wm/paint/auth/picasso/landscapes/picasso.house-garden.jpg
How many special pair Chls are in Picasso’s tree? 140 g Chl / tree 2 “special pair” Chls initiate primary photochemistry ~ 0.5 g Chl special Chls / tree How can this be explained ? Photosynthetic Reaction Center (RC)
light LH2 LH1 RC chemical energy Light Harvesting Timescales
Current Model of the PSU Net Reaction of PSI and PSII: ATP synthase: Uses electrochemical potential to synthesize ATP from ADP Net Reaction of the Calvin Cycle:
2000 1600 1200 umol photons m-2 sec-1 800 400 0 4 8 12 16 20 time of day Photosynthetic organisms experience excessive light on a daily basis excess light rate of photosynthesis rate of light absorption incident light intensity
Pigments From a Portion of the LH2 Ring RG2B bB850B RG2A aB850A B800B B800A RG1B RG1A
Photosynthetic organisms experience frequent short-term fluctuations in light intensity. Külheim et al. (2002) Science 297: 91-93
Photosystem II—3.5 Å D1 = yellow D2 = orange K. N. Ferreira, T. M. Iverson, K. Maghlaoui, J. Barber and S. Iwata. Science. In Press. (2004)
Models for Repair of PSII—D1 Protein E. Baena-Gonzalez and E.-M. Aro. Phil . Trans. R. Soc. Lond. B, 357, 1451-1460 (2002). P. Silva et. al. Phil . Trans. R. Soc. Lond. B, 357, 1461-1468 (2002).
Photoprotection involves regulation of light harvesting heat (nonphotochemical quenching) light short term regulation PS II peripheral LHC inner LHC photochemistry COO- COO- H+ zeaxanthin synthesis LHC protonation and lumen long term regulation thylakoid membrane PS II inner LHC PQH2 stroma regulation of nuclear LHC gene expression
Excess h S1 NPQ ISC (ns) S1 T1 Fluorescence (ps) Fluorescence (ns) ~ 10 ps High Light “ON” S0 So ? Chl What is NPQ? Nonradiative energy dissipation in PSII Purpose: protects PSII from photochemical damage Main Component: qe - “high energy state quenching” High Light (10-20 min.) = Decrease in F (~50%)
- 4H+ - 2H+ P S II Stroma P S I Cyto (b6f) Q cycle + 4H+ + nH+ + 4H+ - 3H+ ATP Synth- ase Lumen pH ~ 4-5 Stroma pH ~ 7-8 pH ~ 3 - 4 H+ c. limiting h Violaxanthin excess h limiting h Antheraxanthin excess h Li, X-P, et al., A pigment-binding protein essential for Regulation of photosynthetic light harvesting. Nature403, 391-395 (2000). Zeaxanthin Necessary components for qE a. ∆pH b. Zeaxanthin c. PsbS a. b.
wild type npq4-1 npq4-1 + vector npq4-1 + psbS NPQ: low high Molecular genetic analysis of npq4-1 showed that PsbS is necessary for qE. wild type npq4-1 4.4 kb genomic DNA hybridization with psbS
4.5 4.0 3.5 3.0 2.5 NPQ 2.0 1.5 1.0 0.5 0.0 0 2 4 6 8 10 12 14 16 Time (min) qE is more than two times greater in the transgenic plants wt+one psbS gene #5 (4 copies of psbS) wild type (2 copies of psbS) wt+one psbS gene #17 (4 copies of psbS) npq4-1 (no psbS) transgenic plants qE =2.9 wild type qE =1.3
Transient Absorption Experiment Sn Probe Soret (1Bu) S2 Energy (cm-1) S2 (1Bu) (1Ag) S1 Qx kET Qy S1 (1Ag) Pump (1Ag) So So (1Ag) So Car Chl a Car Absorption No NPQ NPQ
Transient Absorption Measurements on Arabidopsis Mutants 3 3 wild type + PsbS wild type more PsbS and regular qE 2 2 more qE than wt 1 1 0 0 Quenched* 1.9 Quenched * 1.3 Light ON Amplitude (a.u.) 0 10 20 30 40 50 0 10 20 30 40 50 Light OFF 3 3 npq4- E122Q E226Q npq4-1 more PsbS , but a no PsbS 2 2 pump = 664 nm probe = 540 nm nonfunctional no qE version no qE 1 1 0 0 Amplitude (a.u.) 0 10 20 30 40 50 0 10 20 30 40 50 Time (ps) Time (ps)
Excited States of Xanthophyll-Chlorophyll Dimers cofacial arrangement Qy Qx Qy S2 S1 S1 CT CT Energy in eV Energy in eV Anthera-Chl Zea-Chl ground state ground state Zea-Chl distance in Angstrom Anthera-Chl distance in Angstrom S1 Qx Qy CT Energy in eV Vio-Chl Andreas Dreuw Martin Head-Gordon ground state Vio-Chl distance in Angstrom
Zeaxanthin-Chlorophyll Dimer HOMO LUMO Andreas Dreuw Martin Head-Gordon
TA studies in the near-IR: Formation of the carotenoid radical cation. Spinach thylakoids λPump = 664 nm; λProbe = 1000 nm Near-IR spectra aIn PS II complexes from Synechocystis PCC 6803 (Tracewell, C. A. et al. (2003) Biochemistry, 42, 9127). Difference kinetic indicates charge separations quenching during qE.
Near-IR Arabidopsis thaliana Studies (λpump = 664 nm; λprobe = 1000 nm) Time (ps) Difference Kinetic Fits τrise(ps) τdecay (ps) Detect 1000 nm WT 7.3 210 WT+ PsbS 6.7 136 Detect 540 nm WT - ~ 7 WT+ PsbS - ~ 7 Car+• formation is correlated with qE
One proposed quenching mechanism Gives rise to the positive signal at 1000 nm. Corresponds to the negative (bleaching) signal in the 540 nm region. Assigned time constants kCS ~ 1/(100-300 fs). kRec ~1/(150 ps), corresponds to the recovery dynamics in visible and near-IR regions. gAnn ~ 1/[(10 ps)*n0], n0 – number of initial excitations in the complex. kTr,kAdQ ~1/(100-300 ps). ~1/(10 ps) - corresponds to the net Chl pool decay rate in the vicinity of the charge transfer complex.