Download
1 / 40
400 likes | 572 Views
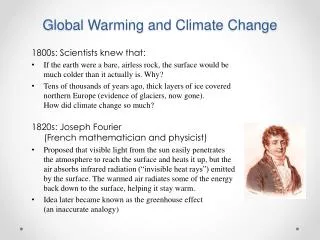
Some Aspects of Climate Change Associated with Global Warming. 余嘉裕 Department of Atmospheric Sciences Chinese Culture University 陳俞綸 劉曉薇 張振瑋 Graduate Institute of Earth Science Chinese Culture University (April 27, 2010 at NCU). Warming Trend. From IPCC AR4 (2007). from IPCC AR4 (2007).

E N D
Some Aspects of Climate ChangeAssociated with Global Warming 余嘉裕 Department of Atmospheric Sciences Chinese Culture University 陳俞綸 劉曉薇 張振瑋 Graduate Institute of Earth Science Chinese Culture University (April 27, 2010 at NCU)
Warming Trend From IPCC AR4 (2007)
Part I Widening of the Tropical Belt : A view from Gross Moisture Stratification
Metrics for Tropical Boundaries Subtropical Jet Stream (e.g., Reichler et al. 2006) Ozone Concentration (e.g., Hudson et al. 2006) Tropopause Height (e.g., Seidel and Randel 2007) Hadley Circulation (e.g., Hu and Fu 2007) (from Seidel et al. 2008)
Data Sources ECMWF 40 years re-analysis data (ERA40), 2.5×2.5 horizontal resolution, from 1958 to 2001 NCEP/NCAR reanalysis data, 2.5×2.5 horizontal resolution, from 1948 to present ECMWF re-analysis interim data (ERA-interim), 1.5×1.5 horizontal resolution, from 1989 to present TRMM Special Sensor Microwave/Imager (SSM/I) water vapor data, 0.25×0.25 horizontal resolution, from 1987 to present
Moisture Budget Equation The vertically-integrated moisture equation yields where and
Moisture Budget Equation (cont’d) Under QE thermodynamic constraint (Neelin and Yu 1994; Yu and Neelin 1997; Neelin and Zeng 2000; Chou et al. 2006), the vertical moisture flux can be approximated by where V1 denotes the QE-driven baroclinic wind: Mq is the “gross moisture stratification” (Yu et al. 1998):
Moisture Budget Equation (cont’d) • Physically, Mq (in units of J/kg) is a quantity measuring the amount of atmospheric moisture that can be converted into precipitation under the QE constraint, if a proper condition of atmospheric convergence occurs. • Over the tropics, the major term balance of (1) gives where denotes low (upper)-level convergence (divergence).
Concluding Remarks (Part I) • The gross moisture stratification (Mq) is shown to be a proper metrics in measuring the tropical boundaries. • Observations based on Mq suggest that tropical belt has expanded quite consistently in the past few decades, with a total expansion of ~6.5 over the 43-year period (1958 ~ 2001), equivalent to expansion trend of ~1.5/decade. • This expansion trend varies depending on season, as a whole, with a maximum in MAM (~1.8/decade), followed by DJF (~1.6/decade) and JJA (~1.4/decade), and a minimum in SON (~1.2/decade).
Part II Impact of Warming on Kuroshio : A study from OGCM Simulations
Major Surface Ocean Currents North Pacific Drift Kuroshio California Current North Pacific Gyre North Equatorial Current ★Kuroshio may modulate regional climate or even weather disturbances through exchanges of sensible and latent heat http://en.wikipedia.org/wiki/File:Ocean_currents_1943_(borderless)3.png#filehistory Atlas of World Maps'', United States Army Service Forces
POP (Parallel Ocean Program) Ocean Model • POP was developed at Los Alamos National Laboratory, (LANL) aiming at increasing understanding of the earth's climate through the use of modeling and high performance computing. • POP is a primitive equation ocean general circulation model (OGCM), with complete dynamics and physics of the ocean and parallelized computing architecture. • The placement of model variables on the horizontal B-grid, with a horizontal grid size is 0.25 degree and 33 levels in z-coordinates (15 levels within the 600m depth).
Winds and Ocean Datasets • Ocean Data National Oceanographic Data Center (NODC) World Ocean Atlas 2001(WOA01): high resolution (0.25 degree) oceantemperature and salinity climatology (1955~2000). • Observed Wind Stress Data National Center for Atmospheric Research/National Centers for Environmental Prediction (NCEP/NCAR) reanalysis at 1000hPa (1950~1999). • IPCC AR4/SRES A2 Model Output Data Current state ocean temperature, salinity and wind stress (1950~1999); future state ocean temperature, salinity and wind stress (2090~2099), all taken as ensemble mean.
IPCC Special Report on Emissions Scenarios http://www.grida.no/climate/ipcc/emission/
Future Climate Projections from IPCC AR4 (2007)
Experiment Design Current State Future State
Surface Current (Exp2) Estimated annual volume transport: 25~45 Sv depending on location Stronger in MAM and JJA; Weaker in DJF and SON
Sea Surface Dynamic Height (Exp2) Maximum SSH over 130cm
Surface Current (Exp4) Kuroshio appears to strengthen throughout the year
Sea Surface Dynamic Height (Exp4) Maximum SSH over 150cm
Surface Current (Exp4-Exp2) Marked enhancement east of Japan; modest enhancement east of Taiwan
Sea Surface Dynamic Height (Exp4-Exp2) SSH increases over 20cm east of Japan, particularly in DJF and MAM
Wind Stress Difference A A A
Concluding Remarks • Oceanic simulations with the SRES A2 scenario suggest that, in response to global warming, the strength of Kuroshio current enhances throughout the year, with the largest enhancement in DJF and MAM. • Moreover, its strengthen may increase as much as 15% in some areas (e.g., to the east of Japan) by the end of the 21th century. • On average, such variations may introduce an extra atmospheric heating of about 32w/m^2(~1.1mm/day) to the east of Taiwan and Japan, while a cooling of about 15w/m^2(~0.5mm/day) to the south of Japan.