Download
1 / 1
20 likes | 159 Views
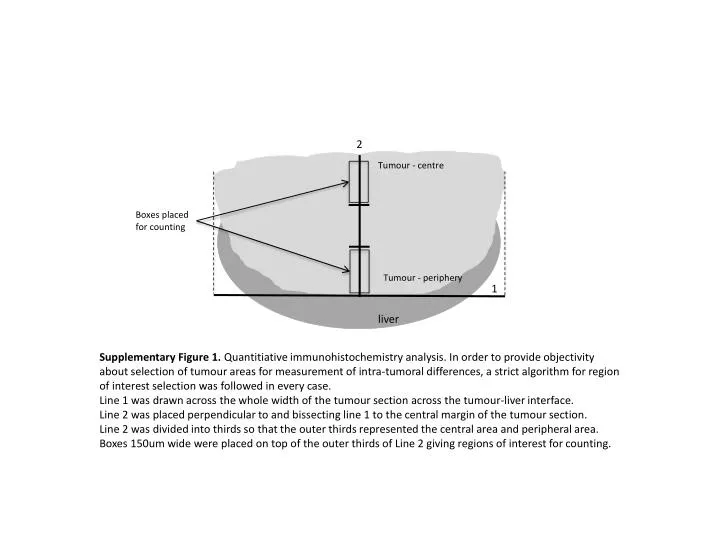
2. Tumour - centre. Boxes placed for counting. Tumour - periphery. 1. liver.

E N D
2 Tumour - centre Boxes placed for counting Tumour - periphery 1 liver Supplementary Figure 1. Quantitiativeimmunohistochemistry analysis. In order to provide objectivity about selection of tumour areas for measurement of intra-tumoral differences, a strict algorithm for region of interest selection was followed in every case. Line 1 was drawn across the whole width of the tumour section across the tumour-liver interface. Line 2 was placed perpendicular to and bissecting line 1 to the central margin of the tumoursection. Line 2 was divided into thirds so that the outer thirds represented the central area and peripheral area. Boxes 150um wide were placed on top of the outer thirds of Line 2 giving regions of interest for counting.


![[EPUB] DOWNLOAD Natural Liver Cleanse Recipes: Liver cleanse juices, liver cleanse tea, Liver cleanse soup, fatty liver](https://cdn7.slideserve.com/12507667/slide1-dt.jpg)