Download

1 / 15
150 likes | 180 Views
Explore various datasets like single variable time series, multivariable time series, raster series, and feature series. Analyze data by location, type, and time to extract valuable insights.

E N D
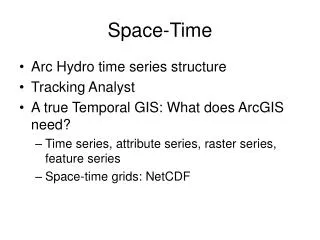
Space-time datasets • Single variable time series – A single variable recorded at a location, such as stream discharge or groundwater levels • Multivariabletimeseries– Multiple variables recorded simultaneously at the same location, such as chemical analysis of a water sample • Timevaryingsurfaces (raster series) – Raster datasets indexed by time. Each rater is a “snapshot” of the environment at a certain time. • Time varying features (feature series) – A collection of features indexed by time. Each feature in a feature series represents a variable at a single time period.
Variable Definition table • Catalog of time varying parameters (e.g. streamflow, water levels, concentrations, etc.) • Each variable is indexed with a HydroID
TimeSeries table • Each measurement is indexed by space, time, and type • Space = FeatureID • Time = TsTime • Type = VarID VarID provides information on the variable
Time series views We can “slice” through the data cube to get specific views of the data WhereandWhat? What? Where? Query by location and type (FeatureID = 2791 VarID = 6875) Query by location (FeatureID = 2791) Query by type (VarID = 6875) TsTime TsTime TsTime 2791 2791 FeatureID FeatureID FeatureID 6875 6875 VarID VarID VarID
Time series views Well HydroID = 2791 • Create a plot of time series related to a feature • Get all the data of VarID 6875 measured at Feature 2791
Time series views A type-time view: Get water levels (TSTypeID =2) for 1/1999 Water level in the Edwards Aquifer in 1/1999 TsTime 1/1991 Set of layers for different times creates an animation FeatureID 6875 VarID
Multi-variable time series • Multiple variables recorded simultaneously at the same location • Example – water quality parameters • Indexed by location (FeatureID), and time (TsTime) • Relationship to the VariableDefinition table is through the VarKey Variables (VarKey)
Multi-variable time series Can query for multiple variables together New Braunfels Springs Well HydroID = 2833
Raster Series • Raster datasets indexed by time • Each raster represents a continuous surface describing a variable for a given time January 1991 January 1992 January 1993
Feature Series • A collection of features indexed by time • Example of particle tracks • Features are indexed by VarID, TsTime, and GroupID • Each group of features creates a track over time
Time series statistics • Summarize values over a given time • Custom tool - part of Groundwater Analyst
Workflow Workflow • Import time series data into AHGW table format • Create time series views – Time Series Statistics tool • Interpolate to create rasters • Load and index rasters in the RasterSeries raster catalog • Animate data Automate workflows with custom models/scripts
DemoGroundwaterAnalyst: creating water level maps and plotting time series data