Download
1 / 1
10 likes | 185 Views
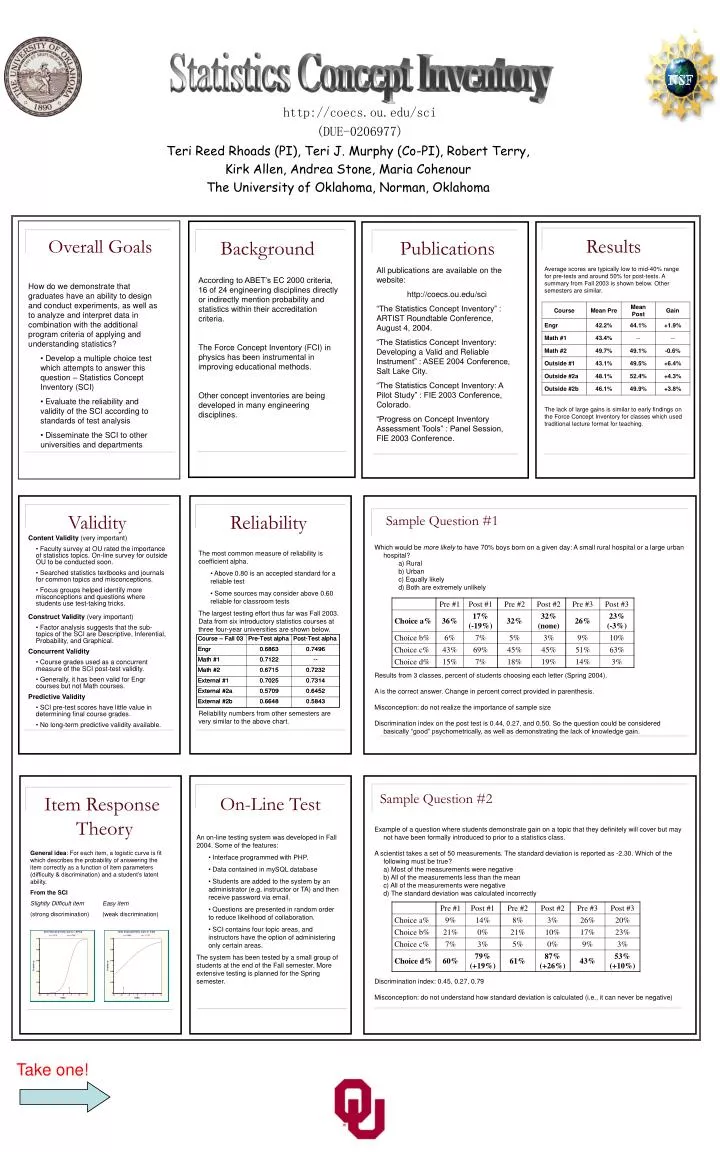
Statistics Concept Inventory. http://coecs.ou.edu/sci (DUE-0206977). Teri Reed Rhoads (PI), Teri J. Murphy (Co-PI), Robert Terry, Kirk Allen, Andrea Stone, Maria Cohenour The University of Oklahoma, Norman, Oklahoma. Results. Overall Goals. Background. Publications.

E N D
Statistics Concept Inventory http://coecs.ou.edu/sci (DUE-0206977) Teri Reed Rhoads (PI), Teri J. Murphy (Co-PI), Robert Terry, Kirk Allen, Andrea Stone, Maria Cohenour The University of Oklahoma, Norman, Oklahoma Results Overall Goals Background Publications All publications are available on the website: http://coecs.ou.edu/sci “The Statistics Concept Inventory” : ARTIST Roundtable Conference, August 4, 2004. “The Statistics Concept Inventory: Developing a Valid and Reliable Instrument” : ASEE 2004 Conference, Salt Lake City. “The Statistics Concept Inventory: A Pilot Study” : FIE 2003 Conference, Colorado. “Progress on Concept Inventory Assessment Tools” : Panel Session, FIE 2003 Conference. Average scores are typically low to mid-40% range for pre-tests and around 50% for post-tests. A summary from Fall 2003 is shown below. Other semesters are similar. The lack of large gains is similar to early findings on the Force Concept Inventory for classes which used traditional lecture format for teaching. According to ABET’s EC 2000 criteria, 16 of 24 engineering disciplines directly or indirectly mention probability and statistics within their accreditation criteria. The Force Concept Inventory (FCI) in physics has been instrumental in improving educational methods. Other concept inventories are being developed in many engineering disciplines. • How do we demonstrate that graduates have an ability to design and conduct experiments, as well as to analyze and interpret data in combination with the additional program criteria of applying and understanding statistics? • Develop a multiple choice test which attempts to answer this question – Statistics Concept Inventory (SCI) • Evaluate the reliability and validity of the SCI according to standards of test analysis • Disseminate the SCI to other universities and departments Validity Reliability Sample Question #1 • Content Validity (very important) • Faculty survey at OU rated the importance of statistics topics. On-line survey for outside OU to be conducted soon. • Searched statistics textbooks and journals for common topics and misconceptions. • Focus groups helped identify more misconceptions and questions where students use test-taking tricks. • Construct Validity (very important) • Factor analysis suggests that the sub-topics of the SCI are Descriptive, Inferential, Probability, and Graphical. • Concurrent Validity • Course grades used as a concurrent measure of the SCI post-test validity. • Generally, it has been valid for Engr courses but not Math courses. • Predictive Validity • SCI pre-test scores have little value in determining final course grades. • No long-term predictive validity available. • Which would be more likely to have 70% boys born on a given day: A small rural hospital or a large urban hospital? • a) Rural • b) Urban • c) Equally likely • d) Both are extremely unlikely • Results from 3 classes, percent of students choosing each letter (Spring 2004). • A is the correct answer. Change in percent correct provided in parenthesis. • Misconception: do not realize the importance of sample size • Discrimination index on the post test is 0.44, 0.27, and 0.50. So the question could be considered basically “good” psychometrically, as well as demonstrating the lack of knowledge gain. • The most common measure of reliability is coefficient alpha. • Above 0.80 is an accepted standard for a reliable test • Some sources may consider above 0.60 reliable for classroom tests • The largest testing effort thus far was Fall 2003. Data from six introductory statistics courses at three four-year universities are shown below. • Reliability numbers from other semesters are very similar to the above chart. Sample Question #2 Item Response Theory On-Line Test Example of a question where students demonstrate gain on a topic that they definitely will cover but may not have been formally introduced to prior to a statistics class. A scientist takes a set of 50 measurements. The standard deviation is reported as -2.30. Which of the following must be true? a) Most of the measurements were negative b) All of the measurements less than the mean c) All of the measurements were negative d) The standard deviation was calculated incorrectly Discrimination index: 0.45, 0.27, 0.79 Misconception: do not understand how standard deviation is calculated (i.e., it can never be negative) • An on-line testing system was developed in Fall 2004. Some of the features: • Interface programmed with PHP. • Data contained in mySQL database • Students are added to the system by an administrator (e.g. instructor or TA) and then receive password via email. • Questions are presented in random order to reduce likelihood of collaboration. • SCI contains four topic areas, and instructors have the option of administering only certain areas. • The system has been tested by a small group of students at the end of the Fall semester. More extensive testing is planned for the Spring semester. General idea: For each item, a logistic curve is fit which describes the probability of answering the item correctly as a function of item parameters (difficulty & discrimination) and a student’s latent ability. From the SCI Slightly Difficult item Easy item (strong discrimination) (weak discrimination) Take one!