Download
1 / 27
270 likes | 337 Views
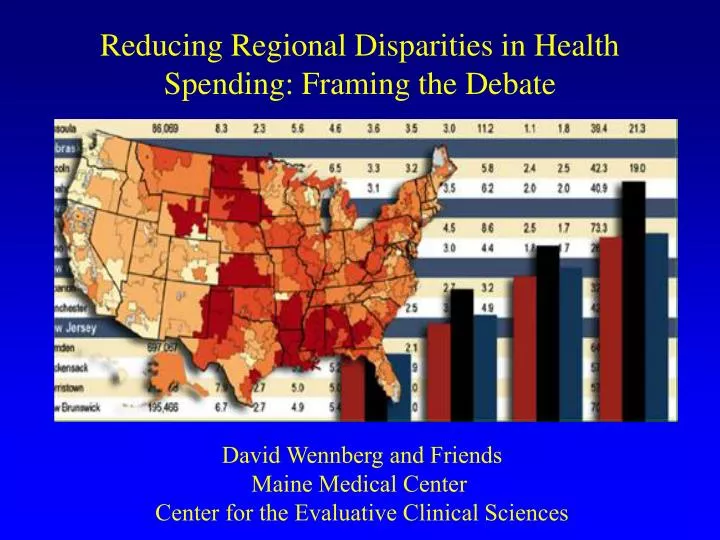
Reducing Regional Disparities in Health Spending: Framing the Debate. David Wennberg and Friends Maine Medical Center Center for the Evaluative Clinical Sciences. Regional disparities in health care spending.

E N D
Reducing Regional Disparities in Health Spending: Framing the Debate David Wennberg and Friends Maine Medical Center Center for the Evaluative Clinical Sciences
Regional disparities in health care spending • Part 1 -- Unwarranted variations in U.S. health care: findings from the ‘Is More Better?’ studies • Part 2 -- What can be done about it?
Elliott Fisher, MD, MPH Therese Stukel, PhD Dan Gottlieb, MSF. L. Lucas, PhD Etoile Pinder, MS
Unwarranted variations in medical practice: a framework for thinking about the delivery (or non-delivery) of care… • Unwarranted? Variations that cannot be explained by: • Illness or need --- and dictates of evidence based medicine • Patient Preferences • Categories of variation • Effective care • Preference sensitive care • Supply-sensitive services • Causes and remedies differ for each category
Dartmouth Atlas of Health CareUnited States Hospital Referral Regions
Q1 HRRs Q2 HRRs Q3 HRRs Q4 HRRs Q5HRRs Low Spending High Elderly (U.S. Medicare) Study Design Myocardial Infarction Colorectal Cancer Hip Fracture Medicare Population (MCBS) Step 1: Select Cohorts Step 2: Group by regional spending level -- assigned based upon End-of-Life Expenditure Index Step 3: Validation (1) are patients the same at baseline? (2) does subsequent treatment differ? Process / Quality of Care / Survival Step 4: Assess outcomes Follow cohorts for up to five years.
Regional Variations in the End-of-Life Expenditure Index (EOL-EI) and average per-capita Medicare spending Spending EOL-EI $ 9,074 $ 3,922 $ 10,636 $ 4,439 $11,559 $ 4,940 $ 12,598 $ 5,444 $ 14,644 $ 6,304 EOL-EI highly correlated (r = 0.81) with average per-capita Medicare spending
Effective Care • Services of proven effectiveness…. • It involves no significant tradeoffs--all with specific needs should receive them • Conflict between patients and providers is minimal
0.5 0.5 1.00 1.00 1.5 1.5 2.0 2.0 25 25 3.0 3.0 General Population Mammogram, Women 65-69 Pap Smear, Women 65+ Flu shot during past year Pneumococcal Immunization (ever) Effective Care: Ratio of Rates in Highest vs Lowest Spending Regions Acute MI Reperfusion in 12 hours for AMI Aspirin at admission Beta Blockers at admission Aspirin at Discharge Beta Blockers at discharge Exercise Test w/in 30 d Lower in High Spending Regions Higher in High Spending Regions
Preference-Sensitive Care • Involves tradeoffs among outcomes • Decision should reflect preferences of patient • Scientific uncertainty often substantial
0.5 0.5 1.00 1.00 1.5 1.5 2.0 2.0 25 25 3.0 3.0 Preference-Sensitive Care:Highest vs Lowest Spending Regions Procedures after AMI Angiography Angiography among appropriate cases Coronary Angioplasty Coronary Artery Bypass Surgery (CABG) Major Surgery (all cohorts combined) Cholecystectomy Cataract Extraction Hernia Repair Total Hip Replacement Total Knee Replacement Back Surgery Carotid Endarterectomy Lower in High Spending Regions Higher in High Spending Regions
Supply Sensitive Services • Care strongly correlated with supply • Generally provided in absence of strong clinical theory • Evidence weak or non-existent on benefits.
Physician Visits 0.5 0.5 1.00 1.00 1.5 1.5 2.0 2.0 25 25 3.0 3.0 Office Visits Inpatient Visits Initial Inpatient Specialist Consultations % of Patients seeing 10 or more MDs Psychotherapy Visits Imaging Tests Chest X-ray CT / MRI Brain Ventilation Perfusion Scan Supply-Sensitive Care : Highest vs Lowest Spending Regions Diagnostic Cardiology Procedures Electrocardiogram Echocardiogram Ambulatory ECG (Holter) Lower in High Spending Regions Higher in High Spending Regions
0.5 0.5 1.00 1.00 1.5 1.5 2.0 2.0 25 25 3.0 3.0 Hospital Utilization Discharges Total Inpatient Days Inpatient Days in ICU or CCU Care in Last Six Months of Life Inpatient Days ICU or CCU days Specialist Procedures Feeding Tube Placement Upper GI Endoscopy Emergency Intubation Bronchoscopy Vena Cava Filter Pulmonary Function Test Electroencephelogram (EEG) Supply-Sensitive Care : Highest vs Lowest Spending Regions Lower in High Spending Regions Higher in High Spending Regions
0.95 1.00 1.05 1.10 Hip Fracture Q1 Q2 Q3 Q4 Q5 Relative Risk of Death across Quintiles of Spending Decreased Risk Increased Risk ColorectalCancer Q1 Q2 Q3 Q4 Q5 MyocardialInfarction Q1 Q2 Q3 Q4 Q5 0.95 1.00 1.05 1.10
0.98 1.00 1.02 1.04 Change in relative risk of death per 10% increment in regional practice intensity: Acute Myocardial Infarction Cohort Decreased Risk Increased Risk Age < 80 Age > 80 Female Male Black Non-black Non-Q MI Anterior MI Inferior MI Other location Low risk (<15% 1yr) Moderate (15-30%) High Risk (> 30%) 0.98 1.00 1.02 1.04
Summary of Findings • Increased spending across regions is largely devoted to “supply-sensitive services” • Visit frequency, specialist services, tests, inpatient and ICU care. • Residents of higher spending regions: • Slightly worse basic access to care • Equal use of major (potentially beneficial) procedures • Quality measures generally somewhat worse • No gain in function, survival or satisfaction
Implications • Costs reflect the capacity of the system
1.19 Spending and capacity: the role of beds and medical specialists High MDHigh Bed 1.35 1.34 High MDLow Bed Low MDHigh Bed 1.59 1.18 Low MDLow Bed
Implications • Costs reflect the capacity of the system • Greater capacity is not necessarily better
Implications • Costs reflect the capacity of the system • Greater capacity is not necessarily better • We’re wasting 30% of current spending on supply sensitive care alone…
Regional disparities in health care spending • Part 1 -- Unwarranted variations in U.S. health care: findings from the ‘Is More Better?’ studies • Part 2 -- What can be done about it?
Principles to Guide Interventions Variation Cause Remedy Effective Care Poorly understood care processes Failure to learn Develop systems of care capable of improvement Reward those who provide high quality care Construct benefits to ‘incent’ beneficiaries to become active consumers and to seek ‘high quality providers’
Effective Care and Patient Safety Poorly understood care processes Develop systems of care capable of improvement Shared Decision Making Construct Benefits to ‘Steer’ insured to high quality providers AND ‘incent’ them to seek SDM information and coaching Reward providers for participating in SDM Preference Sensitive Care MD-dominated decisions Principles to Guide Interventions Variation Cause Remedy
Effective Careand Patient Safety Poorly understood care processes Develop systems of care capable of improvement Shared Decision making Preference Sensitive Care MD-dominated decisions Supply Sensitive Care Variations in supply Assumption that more is better Micro: selective contracting with longitudinally efficient providers Demand excellence in effective care and preference sensitive care Macro: discourage continual increases in system capacity Principles to Guide Interventions Variation Cause Remedy
Regional disparities in health care spending • Part 1 -- Unwarranted variations in U.S. health care: findings from the ‘Is More Better?’ studies • Part 2 -- What can be done about it?