Download
1 / 40
420 likes | 744 Views
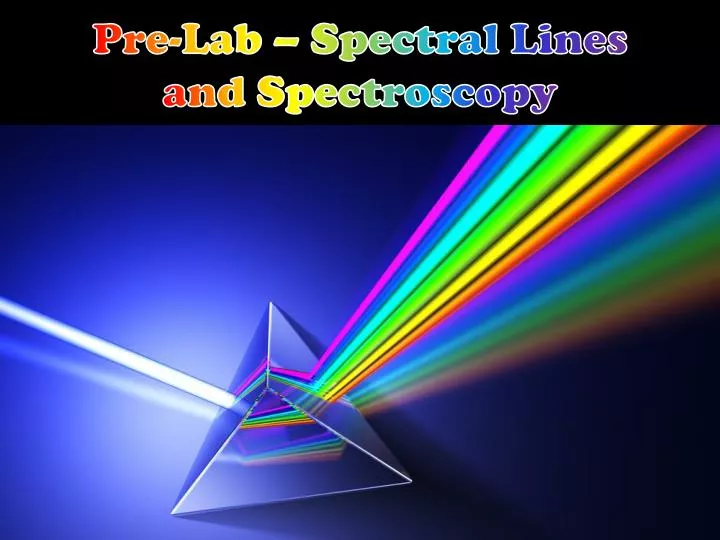
Pre-Lab – Spectral Lines and Spectroscopy. Pre-Lab – Spectral Lines and Spectroscopy. When a beam of white light is shone through a prism, a rainbow of colors spread out to the right of the prism. The band of colors you see is called a visible spectrum .

E N D
Pre-Lab – Spectral Lines and Spectroscopy When a beam of white light is shone through a prism, a rainbow of colors spread out to the right of the prism. The band of colors you see is called a visible spectrum. The ability of a prism to separate white light into a spectrum is called dispersion.
Pre-Lab – Spectral Lines and Spectroscopy Use the diagram below to Answer Questions 1 and 2 on your Pre-Lab Questions.
Pre-Lab – Spectral Lines and Spectroscopy 3. Single color beam has been selected. The color bar slider is moved from 400 nm to 700 nm, stopping every 50 nm to measure the angle of refraction.
Pre-Lab – Spectral Lines and Spectroscopy 3. Use the pictures on the next several pages to fill in angle of refraction on the table for Question 3: 400 nm (Violet)
Pre-Lab – Spectral Lines and Spectroscopy 3. Use the pictures on the next several pages to fill in angle of refraction on the table for Question 3: 450 nm (Indigo)
Pre-Lab – Spectral Lines and Spectroscopy 3. Use the pictures on the next several pages to fill in angle of refraction on the table for Question 3: 500 nm (Blue)
Pre-Lab – Spectral Lines and Spectroscopy 3. Use the pictures on the next several pages to fill in angle of refraction on the table for Question 3: 550 nm (Green)
Pre-Lab – Spectral Lines and Spectroscopy 3. Use the pictures on the next several pages to fill in angle of refraction on the table for Question 3: 600 nm (Yellow)
Pre-Lab – Spectral Lines and Spectroscopy 3. Use the pictures on the next several pages to fill in angle of refraction on the table for Question 3: 650 nm (Orange)
Pre-Lab – Spectral Lines and Spectroscopy 3. Use the pictures on the next several pages to fill in angle of refraction on the table for Question 3: 700 nm (Red)
Pre-Lab – Spectral Lines and Spectroscopy 4. Quickly flip from slide 11 (700 nm/red) to slide 5 (400nm/violet) and back again. Answer Question 4 on your Pre-Lab Questions:
Lab – Gas Tube Bright Line (Emission) Spectra - Demo Look at a continuousspectrumby pointing your spectroscope at an incandescent light bulb or a brightly sunlit cloud. (Do notlook directly at the sun!)
Lab – Gas Tube Bright Line (Emission) Spectra - Demo Now point your spectroscope at the fluorescent lights overhead. You will see a continuous spectrum, but you will alsosee 3 or 4 brightly colored stripes superimposed on the continuous spectrum. 400 500 600 700
Lab – Gas Tube Bright Line (Emission) Spectra - Demo The Mercury vapor gas tube will show those same stripes on a black background. This is the emission or bright line spectrum for Mercury vapor. 436 503 546 577/579 408* 615/623* *=may be hard to see
Lab – Gas Tube Bright Line (Emission) Spectra Q 5 – 6: Use colored pencils to draw in the 4 or 5 brightest spectral lines for Mercury vapor in the spectrum bar on your answer sheet: Mercury vapor gas tube
Lab – Gas Tube Bright Line (Emission) Spectra Use your spectroscope to observe the bright line spectra for Hydrogen, Heliumand Argon. Q 7 – 12: Use colored pencils to draw 3 – 6 spectrallinesfor each gas on your lab answer sheet:
Pre-Lab, Part 2 – Emission Spectra of Hydrogen Each element has its own distinct group of spectral lines called its spectral signature. The table below shows the BalmerSeries for the (Visible) Rest Wavelengths of Hydrogen:
Pre-Lab, Part 2 – Emission Spectra of Hydrogen • Translating that into “English”: • The Balmer Seriesare the 4 visible wavelengthsoflightgiven off by glowingHydrogengas. • We drew 3 of those 4 wavelengths during the introlab (we can’t see the deepviolet).
Pre-Lab, Part 2 – Emission Spectra of Hydrogen • Translating that into “English”: • Rest Wavelengthsmeans the normal wavelengths of light are measured when the object/ galaxy is at rest(sitting stilllike those gas tubes on the lab counter.) • Later on, we’ll be looking at light from distantgalaxies that are really speedingalong!!
Handout 1 – Hydrogen Absorption & Emission Lines • Background Information – Visible Light Spectrum (“rainbow” pattern at top of page) • The visible light spectrumranges from 380 nm(violet) at left to 760 nm (red) at right. • The “rainbow” is broken up by4 distinct black stripes:
Handout 1 – Hydrogen Absorption & Emission Lines • The “rainbow” is broken up by 4 distinct black stripes: • These stripes match up with 4wavelengthsof light that are absorbedby coolhydrogen gas as the light passes through a distant galaxy, star or planetaryatmosphere. • This type of spectrum is called an absorptionor dark-line spectrum. • * Answer Question 13 on your Pre-Lab Questions.
Background Information – Bohr Model Diagram • (Energy Levels shown as Circles) • When an electron is excitedby light, heat or electrical energy, it absorbsthat energy and bouncesupto a higher energy level (called the excited state).
Handout 1 – Hydrogen Absorption & Emission Lines • Background Information – Bohr Model Diagram (Energy Levels shown as Circles) • When the electron “calms down”, it givesoffthe energyand dropsback downto a lowerenergylevel (called the “rest” state). • When it drops, it emits(gives off) the energyit absorbed as light energy.
Handout 1 – Hydrogen Absorption & Emission Lines • Background Information – Bohr Model Diagram (Energy Levels shown as Circles) • When an electron drops a certainamount (Ex: Level n = 3 to level n = 2), it always gives off the same amount of energy, resulting in the samewavelength(color) of light being emitted.
Handout 1 – Hydrogen Absorption & Emission Lines • Background Information – Bohr Model Diagram (Energy Levels shown as Circles) • (In our example, a drop from n = 3 n = 2causes a photonof redlight with a wavelength of 656.3 nm to be emitted.) • These jumps of the electron from one energy level to another are called quantum leaps. • [See Next Page.)
Handout 1 – Hydrogen Absorption & Emission Lines • Background Information - Energy Level Diagrams • The quantum leaps that produce the 4 visible colors of light are called the BalmerSeries:
Handout 1 – Hydrogen Absorption & Emission Lines • Background Information – • Energy Level Diagrams • Lyman Series - The 2 1 quantum leap is huge, so all leaps down to level 1 (Ex: 3 1) cause much higherenergy, shorterwavelengthultraviolet(UV)photonsto be emitted.
Handout 1 – Hydrogen Absorption & Emission Lines • Background Information - Energy Level Diagrams • PaschenSeries - The jumps down to level 3 • (Ex: 5 3) are much smaller, so they create longerwavelength, lower energyInfra-Red (IR) photons. • Answer Questions 14 - 16 on your • Pre-Lab Questions.
Handout 2 – Emission Line Spectrum for Hydrogen • Emission spectra (and absorption spectra) can be converted into a line graph. It is not as colorful as the other spectra, but it has two advantages: • You can read the wavelengthvalue of the bright lines (peaks) much more precisely. • You can measure the relativestrengthof each of the bright lines. For example:
Handout 2 – Emission Line Spectrum for Hydrogen • On the diagram below, there is a strong peak(≈ 450) at 5000angstroms(5000Å =500.0 nm) • The second highest peak • is at 4950 Å and is only • about ¼ of the strength • of the 5000Å peak. 4600 4800 5000 5200 5400 5600
Handout 2 – Emission Line Spectrum for Hydrogen • The topdiagram on Handout 2 shows an emission line spectrogram for Hydrogen superimposed on a continuous spectrum to emphasize the colors involved. • Ha , Hband Hgare labeled. • Answer Questions 17 – 20 on your Pre-Lab Questions.
Handout 2 – Emission Line Spectrum for Hydrogen • The bottomdiagram on Handout 2 shows an emission line spectrogram for Hydrogen as it will appear on the rest of the lab. • Ha , Hband Hgare labeled. • Answer Questions 21 - 24 on your Pre-Lab Questions.