Download
1 / 38
380 likes | 481 Views
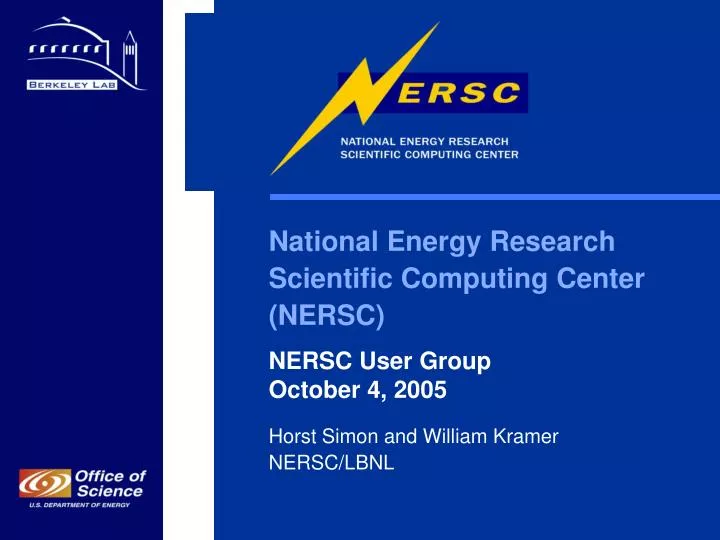
National Energy Research Scientific Computing Center (NERSC) NERSC User Group October 4, 2005 Horst Simon and William Kramer NERSC/LBNL. Science-Driven Computing. NERSC is enabling new science. NERSC Must Address Three Trends.

E N D
National Energy Research Scientific Computing Center (NERSC) NERSC User Group October 4, 2005 Horst Simon and William Kramer NERSC/LBNL
Science-Driven Computing NERSC is enabling new science
NERSC Must AddressThree Trends • The widening gap between application performance and peak performance of high-end computing systems • The recent emergence of large, multidisciplinary computational science teams in the DOE research community • The flood of scientific data from both simulations and experiments, and the convergence of computational simulation with experimental data collection and analysis in complex workflows
Science-Driven Systems • Balanced and timely introduction of best new technology for complete computational systems (computing, storage, networking, analytics) • Engage and work directly with vendors in addressing the SC requirements in their roadmaps • Collaborate with DOE labs and other sites in technology evaluation and introduction
Science-Driven Services • Provide the entire range of services from high-quality operations to direct scientific support • Enable a broad range of scientists to effectively use NERSC in their research • Concentrate on resources for scaling to large numbers of processors, and for supporting multidisciplinarycomputational science teams
Science-Driven Analytics • Provide architectural and systems enhancements and services to more closely integrate computational and storage resources • Provide scientists with new tools to effectively manipulate, visualize and analyze the huge data sets from both simulations and experiments
Impact on Science Mission • Majority of great science in SC is done with medium- to large-scale resources • In 2003 and 2004 NERSC users reported the publication of at least 2,206 papers that were partly based on work done at NERSC.
HPSS HPSS SGI SGI NERSC System ArchitectureApril 2005 Visualization Server – “escher” SGI Onyx 3400 – 12 Processors 2 Infinite Reality 4 graphics pipes 24 Gigabyte Memory 5Terabytes Disk HPPS 14 IBM SP servers 35 TB of cache disk 8 STK robots, 44,000 tape slots, 24 - 200 GB drives, 60 - 20 GB drives Max capacity 9 PB ETHERNET 10/100 Megabit Visualization Server – “Davinci” SGI Altix – 8 Processors 48 Gigabyte Memory 3Terabytes Disk (.5,62) SYMBOLIC MANIPULATION SERVER STK Robots FC Disk 10 Gigabit, 1 Gigabit EthernetJumbo 1 Gigabit Ethernet OC 48 – 2400 Mbps ESnet Testbeds and servers IBM SP NERSC-3 – “Seaborg” 6,656 Processors (Peak 10 TFlop/s) SSP – 1.35 Tflop/s 7.8 Terabyte Memory 55 Terabytes of Shared Disk Ratio = (0.8,4.8) NCS Cluster – “jacquard” 650 CPU Opteron/Infiniband 4X/12X 3.1 TF/ 1.2 TB memory SSP - .41 Tflop/s 30 TB Disk Ratio = (.4,10) PDSF~800 processors (Peak ~1.25 TFlop/s) ~1 TB of Memory 135 TB of Shared Disk Gigabit and Fast EthernetRatio = (0.8, 96) Ratio = (RAM Bytes per Flop, Disk Bytes per Flop)
NERSC Focus is on Capability Computing 90% Gross Utilization >2047 CPUs 1024-2047 CPUs 256-511 CPUs 512-1023 CPUs HOURS 64-255 CPUs 1-63 CPUs
Computational Systems Must Support a Diverse Workload • NERSC’s priority is capabilitycomputing, “The goal [of capability systems] is to solve a large problem or to solve a single problem in a shorter period of time. Capability computing enables the solution of problems that cannot otherwise be solved in a reasonable period of time … also enables the solution of problems with real-time constraints (e.g., intelligence processing and analysis). The main figure of merit is time to solution.” - NRC Report on Supercomputing • Working definition is the use of one-tenth or more of an entire computing resource over an extended time period • Includes INCITE and SciDAC projects • Large-scale computing • The use of significant computational resources over an extended time period • Interactive and analysis computing • Use significant amounts of memory and I/O bandwidth for interactive analysis with modest scalability • A modest amount of capacity computing that isrelated to the capability and large-scale applications “Smaller and cheaper systems … where smaller problems are solved. Capacity computing can be used to enable parametric studies or to explore design alternatives; it is often needed to prepare for more expensive runs on capability systems. … The main figure of merit is sustained performance per unit cost.” – NRC Report on Supercomputing • Working definition is computing that is comparable to running on a desktop system for a week
Computational SystemsTechnology Choices • Completely commodity supercomputers built using off-the-shelf processors developed for workstations and commercial applications and connected by off-the-shelf networks • Examples are NERSC’s PDSF system, the Virginia Tech Big Mac cluster, the UCB Millennium cluster, and a host of integrated solutions • Custom supercomputers use processors and interconnects that are specialized. The systems provide specialized and high-bandwidth interconnects and processor-memory interfaces. • Examples are the Cray X1 and the NEC SX-8 • Hybrid supercomputers combine commodity processors with custom high-speed interconnects and/or accelerators to enhance science performance • Examples include the ASCI Red Storm, Cray T3E, SGI Altix, and IBM SP • System customization: Adjust the system configuration without employing any new/unique technologies • Example, the Blue Planet node’s 8-way IH systems instead of 64-way • Requires careful attention/understanding of code bottlenecks and that those bottlenecks can be fixed by adding or swapping existing hardware • Technology customization: specialized/custom modification to embedded components for special value-added accelerators • Example: ViVA • Requires a long-term commitment by partners given that product development cycles typically require 2- to 5-year lead time • Rather than three distinct categories, this taxonomy represents a spectrum of choices
Computational SystemsStrategy • The total annual investment in the computational systems will remain approximately one-third of the NERSC annual funding • Lease-to-own payments for a major system will be spread over three years • Technology availability may dictate a phased introduction • NERSC uses the “best value” process • Allows considerable flexibility for NERSC and provides an opportunity for significant innovation by suppliers • One key metric we use is what we call the Sustained System Performance (SSP) metric, which is based on a benchmark performance integrated over three years • The Effective System Performance (ESP) test assesses system-level efficiency, namely the ability of the large-scale system to deliver a large fraction of its potential resources to the users • NERSC will use a sets of benchmark kernels and full applications to assess system • NERSC is exploring advanced modeling methods for its applications to project the performance of systems as well as to guide the Science-Driven System Architecture efforts
Sustained System Performance (SSP) Test • NERSC focuses on the area under the measured curve • SSP is responsible for assuring delivered performance • SSP is conservative so most applications do better • To achieve the required performance, NERSC-3 has a 22% higher peak performance than planned • The higher final result benefits the community for the long term Test/Config, Acceptance,etc Software lags hardware • SSP = Measured Performance * Time
FullConfig FullConfig Number of CPUs - P ti pi Shutdown and Boottime = S Submit Submit Submit Elapse Time - T Effective System Performance (ESP) Test • Test uses a mix of NERSC test codes that run in a random order, testing standard system scheduling • There are also full configuration codes, I/O tests, and typical system administration activities • Independent of hardware and compiler optimization improvements • The test measures both how much and how often the system can do scientific work Effectiveness = (∑1Npi* ti)/[P*(S+T)]
37 Tflop/s-years of SSP performance Between 2005 and 2010 Computational SystemsCost Projections
Science-Driven System Architectures Goals • Broadest, large-scale application base runs very well on SDSA solutions with excellent sustained performance per dollar • Even applications that do well on specialized architectures could perform near optimal on a SDSA Architectures
Science-Driven System Architecture Goals • Collaboration between scientists and computer vendors on science-driven system architecture is the path to continued improvement in application performance • Create systems that best serve the entire science community • Vendors are not knowledgeable in current and future algorithmic methods • When SDSA started, system designers were working with algorithms that were 10 years old • Did not consider sparse matrix methods of 3D FFTs in design of CPUs • NERSC staff and users represent the scientific application community • Active collaboration with other groups: DARPA, NGA, etc. • Early objectives: • ViVA-2 architecture development – Power6 scientific application accelerator • Additional investigation with other architectures • Lower interconnect latency and large spanning • Long-term objectives: • Integrate lessons of the large-scale systems, such as the Blue Gene/L and HPCS experiments, with other technologies, into a hybrid system for petascale computing. • SDSA applies to all aspect of NERSC – not just parallel computing • Facility-Wide File Systems
NERSC Expertise is Critical to SDSA Process • Samples of Algorithms and Computational Science Successes • Numerical and System Libraries – SuperLU, ScaLAPACK, MPI-2, parallel netCDF • Applications and Tools - ACTS Toolkit • Programming Languages - UPC • System Software - Linux Checkpoint/Restart, VIA Protocol • Mixed-mode programming studies • APDEC/NASA Computational Technology Center • Performance evaluation and analysis • LBNL staff includes authors of widely used evaluation tools: NAS Parallel Benchmarks (NPB), Sustained System Performance (SSP) benchmark, Effective System Performance (ESP) benchmark • The “Performance Evaluation Research Center” (PERC), a multi-institution SciDAC project funded by DOE • Tuning and analysis of dozens of applications on NERSC scalar and vector systems • Architecture evaluation and design • Multi-application study of the Earth Simulator • Other studies of Cray X1, NEC SX-6, IBM BlueGene/L, Cray Red Storm, Tera MTA, Sun Wildfire, etc. • Collaborators on architecture design projects, including Blue Planet • Clusters: UCB Millennium and NOW, Processor in Memory (PIM) • RAID • HPSS
InternalInterconnect InternalInterconnect InternalInterconnect InternalInterconnect File SystemNode File SystemNode GatewayNode ComputeNode ComputerNode LAN/WAN Data Divergence Problem The memory divergence problem is masking the data divergence problem Colliding Black Holes – 2-5 TB files for each time step
InternalInterconnect InternalInterconnect InternalInterconnect InternalInterconnect GatewayNode ComputeNode ComputerNode File SystemNode InternalInterconnect InternalInterconnect InternalInterconnect InternalInterconnect InternalInterconnect InternalInterconnect InternalInterconnect InternalInterconnect InternalInterconnect InternalInterconnect InternalInterconnect LAN/WAN GatewayNode ComputeNode ComputerNode GatewayNode ComputeNode ComputerNode File SystemNode File SystemNode InternalInterconnect InternalInterconnect InternalInterconnect InternalInterconnect InternalInterconnect InternalInterconnect InternalInterconnect InternalInterconnect InternalInterconnect LAN/WAN LAN/WAN File SystemNode File SystemNode File SystemNode File SystemNode File SystemNode File SystemNode GatewayNode GatewayNode GatewayNode ComputeNode ComputeNode ComputeNode ComputerNode ComputerNode ComputerNode LAN LAN LAN WAN Facility-Wide File System
NERSC Storage Growth Increase: 1.7x per year in data growth 45 million files makes NERSC one of the largest sites
Mass StorageProjected Data Growth and Bandwidth Requirements 2005–2010 Up to 6 TB per day this year
Mass StorageBandwidth Needs As Well • A transfer of a 372 GB file takes 3 to 4 hours at today’s 30 MB/s • Striping the data across three tape drives shortens time to 1 hour • FY 05 new technology tape drives with transfer rates of 120 MB/s so access time will be 5 minutes
Networking • NERSC will join the Bay Area Metropolitan Area Network (BA MAN) in 2005 • One 10 Gb/s link for production traffic • Second 10 Gb/s link for projects, dedicated high-bandwidth services, testing • NERSC and ESnet are working to deploy Quality of Service (QoS) capability that will permit high-priority network traffic to receive dedicated bandwidth • Expand to allow dynamic provisioning of circuits across both Abilene and ESnet • “Bandwidth corridors” could support real-time processing of experimental data • End-to-end support • NERSC expertise troubleshooting and optimizing data transfers between remote user sites and NERSC resources • NERSC is one of the few sites that troubleshoots problems end to end and actively engages with service providers and site networking staff
What is Analytics? • Science of reasoning • Generate insight and understanding from large, complex, disparate, sometimes conflicting data • Visual analytics: • Science of reasoning facilitated by visual interfaces • Why visual? • High bandwidth through human visual system • Better leverage human reasoning, knowledge, intuition and judgment • Intersection of: • Visualization, analysis, scientific data management, human-computer interfaces, cognitive science, statistical analysis, reasoning, …
NERSC’s Analytics Strategy • NERSC Analytics Strategy: • Objective: Improve scientific productivity by increasing analytics capabilities and capacity for NERSC user community • Several key strategy elements: scientific data management, visualization, analysis, support and integrated activities • Understand user needs in analytics • Provide the visualization and analysis tools needed to realize analytics capabilities • Increase capability and capacity of NERSC’s data management infrastructure • Support distributed computing (analytics) activities • Support proliferation and use of analytics capabilities in the NERSC user community
HPSS HPSS SGI 2007 Visualization and Post Processing Server 64 Processors .4 TB Memory 60 Terabytes Disk HPPS 100 TB of cache disk 8 STK robots, 44,000 tape slots, max capacity 44 PB ETHERNET 10/100/1,000 Megabit Testbeds and servers NCS-b – SSP - ~.7-.8 Tflop/s 2 TB Memory 70 TB disk Ratio = (0.25, 9) STK Robots FC Disk 10 Gigabit, Jumbo 10 Gigabit Ethernet OC 192 – 10,000 Mbps PDSF~1,000 processors ~1.5 TF, 1.2 TB of Memory ~300 TB of Shared DiskRatio = (0.8, 20) IBM SP NERSC-3 – “Seaborg” 6,656 Processors (Peak 10 TFlop/s) SSP – 1.35 Tflop/s 7.8 Terabyte Memory 55 Terabytes of Shared Disk Ratio = (0.8,4.8) Storage Fabric NCS Cluster – “jacquard” 650 CPU Opteron/Infiniband 4X/12X 3.1 TF/ 1.2 TB memory SSP - .41 Tflop/s 30 TB Disk Ratio = (.4,10) GUPFS NERSC-5 SSP ~4-6 Tflop/s Ratio = (RAM Bytes per Flop, Disk Bytes per Flop)
HPSS HPSS SGI 2009 HPPS 1000 TB of cache disk 8 STK robots, 44,000 tape slots, max capacity 150 PB Visualization and Post Processing Server 100 Processors 4 TB Memory ETHERNET 10/100/1,000 Megabit Testbeds and servers NCS-b – SSP - ~.7-.8 Tflop/s 2 TB Memory 70 TB disk Ratio = (0.25, 9) STK Robots FC Disk 40 Gigabit, Jumbo 40 Gigabit Ethernet OC 768 – 40,000Mbps PDSF41,000 processors (Peak 833 GFlop/s) 4 TB of Memory 2000 TB of Shared DiskRatio = (0.8, 96) Storage Fabric NCSc ~13 TF SSP ~3 Tflop/s GUPFS NERSC-6 SSP ~15-20 Tflop/s NERSC-5 SSP ~4-6 Tflop/s Ratio = (RAM Bytes per Flop, Disk Bytes per Flop)
The Primary Messages • Hybrid systems are the most likely computational system for the diverse NERSC workload over this time period • The Science-Driven System Architecture process is critical to the success of NERSC • NERSC has methods that choose systems that best serve the entire community to maximize science productivity • NERSC provides a balanced facility with storage, networking, and support systems