Download
1 / 51
510 likes | 704 Views
Observed Distribution of Pressure and Winds. (b) The real Earth has disruptions in the zonal pattern caused by large landmasses. These disruptions break up pressure zones into semi-permanent high and low pressure cells. (a) An imaginary uniform Earth with idealized zonal (continuous

E N D
Observed Distribution of Pressure and Winds (b) The real Earth has disruptions in the zonal pattern caused by large landmasses. These disruptions break up pressure zones into semi-permanent high and low pressure cells. (a) An imaginary uniform Earth with idealized zonal (continuous east to west) pressure belts
Semipermanent Pressure Systems: Land Sea interactions and Topography complicate the circulation patterns. We have viewed these pressure belts as continuous systems around the earth up to this point. However, because the Earth is not uniform, at most latitudes (more so in the northern hemisphere) the zonal belts are replaced by semipermanent cells of high and low pressure.
Average Surface Pressure Systems and Associated Circulation January Siberian High, Azores High Aleutian Low, Icelandic Low
Average Surface Pressure Systems and Associated Circulation July Bermuda High
Monsoons The seasonal reversal of wind direction associated with large continents, especially Asia. In the winter, the wind blows from….. the land to the sea; in the summer, it blows from the sea to the land. The Asian Monsoon The Asian Monsoon is the result of a complex interaction between the Siberian High (which is strongest in the wintertime), the migration of the ITCZ, and the topography of the region (i.e. the Himalayan mountain range and the Tibetan Plateau).
The Asian monsoon circulation occurs in conjunction with the seasonal shift of the ITCZ and development of the Siberian High. (dry, cool, continental air)
In the summer ITCZ migrates north and the Siberian High weakens which allows results in a reversal in wind direction. (moist, warm, maritime air)
Monsoons The North American Monsoon Extreme summertime heating over the desert Southwest, creates a low pressure system centered over Arizona that draws in warm, moist air from the Gulf of California.
The Westerlies Pilots flying missions during World War II, collected a great volume of data on upper air conditions over the middle latitudes. One of the most important observations was the presence of a prevailing westerly flow (zonal) in the upper troposphere. Temperature differences between the equator and the poles drives the westerlies. How? Winds are created and maintained by pressure differences which are the result of temperature differences (the pressure gradient is south to north). The Coriolis force bends the winds to the right (in the Northern Hemisphere). A west to east winds is a westerly wind.
The Westerlies The pressure gradient force pushes winds poleward, the Coriolis force deflects winds to the right; a balance is reached between the poleward-directed pressure gradient force and the Coriolis force which results in a westerly wind.
The Jet Streams Altitude: 7500m-12,000m (25,000ft-40,000ft) Width: <100km-500km (60mi - 300mi) Depth: ~1-3km Wind Speeds: often >200 km/hr (120mi/hr) upper limit: 400 km/hr (240mi/hr) Within the westerly flow are narrow ribbons of high wind speeds known as jet streams. The most studied jet stream is the mid- latitude jet stream.
Seasonal migration of the mid-latitude jet stream 30 day Mean Jet Stream Jan 2001 30 day Mean Jet Stream Jun 2001 Notice the northward migration of the jet stream in the summertime. Temperature contrasts are greatest in the wintertime (in the northern hemisphere).
Seasonal Migration of the Polar Jet Stream Just like the ITCZ and the semi- permanent pressure systems, the midlatitude jet stream migrates seasonally. The seasonal migration is in response to the migration of the sun’s vertical rays.
Other visualizations of the Jet Streams The jet stream is not a continuous ribbon of fast moving air.
Origin of the Jet Streams It is the large temperature contrast at the surface which create the great differences in pressures aloft (steep gradient) which results in fast winds. The large temperature contrast occur along lines called fronts. The midlatitudinal jet stream occurs along a major frontal zone called the polar front.
Subtropical Jet Sream Midlatitude Jet Stream Subtropical Jet Stream The Sub Tropical Jet: The average level of the core of this westerly jet lies at an altitude of about 40,000 ft (12 km) and flows just below the tropical tropopause. It occurs in the latitude range 25-40 deg N/S, and is most marked during the winter and early spring of each hemisphere, but is not associated with any surface frontal structure. Water Vapor Image
Waves (Rossby Waves) in the Westerlies Rossby waves are very long wave 4000-6000 km named after C.G. Rossby, who first explained the nature of these waves. Simplified 500-millibar height contour chart for January. The position of the jet stream core is shown in dark. Idealized flow at 500millibar level. The five long-wavelength undulations, called Rossby waves, compose the flow. The jetstream is the fast core of this wavy flow.
A closer look at the midlatitude (polar) jet stream The closer the isoheights faster the winds.
Westerlies and the Earth’s Heat Budget Recall that the wind is responsible for ~75% of heat transfer which maintains the Earth’s heat budget. Based on the three-cell theory over much of the Earth winds are zonal (west to east) which does not transfer heat to the poles. How then does global circulation transfer energy?
Global Winds and Ocean Currents Major Ocean Currents. Poleward-moving currents are warm, and equatorward -moving currents are cold. When wind blows over the ocean friction from the air transfers energy to the water. Ocean currents are reflective of the global air circulation.
Ocean Currents and Upwelling Air moving over water pushes water in the direction of the wind causing upwelling to occur. Water from below rises up to fill the void left by the surface water. Water from deep layers is often rich in nutrients which fish feed off of. Upwelling is a very important process in the food chain.
Seasonal variations in upwelling in the Arabian Sea. Sea-viewing Wide Field of View Sensor(SeaWiFS) Composite image of 'ocean colour' of the Indian Ocean in September-October, towards the end of the Indian summer monsoon (left), and May-June, towards the end of the winter monsoon (right) (courtesy NASA/GSFC).
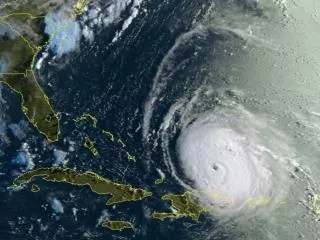
What is an El Niño? El Niño is a disruption of the ocean-atmosphere system in the tropical Pacific having important consequences for weather around the globe.
El Niño and La Niña Under normal conditions the strong Peruvian current prevails most of the year.
El Niño and Southern Oscillation (ENSO) Illustration of the see-saw pattern of atmospheric pressure between the eastern and western Pacific, called the Southern Oscillation. (a) Normal years (b) El Niño years
Tracking El Niño From Space Topex/Posiden satellite Prior to El Niño Onset of El Niño Sea Surface height tells us much about the temperature of the water which gives us information about ENSO. Strong El Niño Decay of El Niño