Download
1 / 14
140 likes | 224 Views
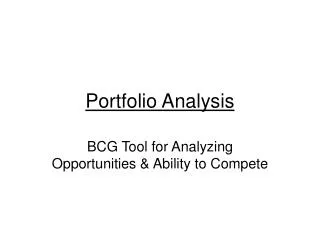
Portfolio analysis exercise. Présenté par: Aimane El Bakkali et Chantale Tremblay. Plan de présentation. Mise en contexte Objectif Matrice Question 1 Question 2 Question 3 Question 4 Conclusion Questions. Mise en contexte. 1995: restructuration de Conglomerate Inc.

E N D
Portfolio analysis exercise Présenté par: Aimane El Bakkali et Chantale Tremblay
Plan de présentation • Mise en contexte • Objectif • Matrice • Question 1 • Question 2 • Question 3 • Question 4 • Conclusion • Questions
Mise en contexte • 1995: restructuration de Conglomerate Inc. • Organisation divisée et subdivisée • CAS: Food production and products division (FPPD) • Comprend 3 SBU’s en BtoC et 1 SBU en BtoB • Contrôle : M. Henry Antworth
Objectif • Examen stratégique sur l’état présent et futur de ces 4 SBU’s
Matrice GE Selective grownth Selective Investissement + grownth Selective grownth Harvest Selective Harvest Harvest Selective
Présentation • Feuille du cas sur Excel • Présenter fonctionnement
Question 1 • Toutes les SBU’s sont concentrées dans la case «Harvest» (récolte) • Ne pas investir, on récolte profits C.T en ne regardant pas L.T • Dirigeant devrait suggérer la diversification
MIN MAX Trans Salt POWER UBC Situation
Question 2 • La méthode GE: • Avantages • Représentation graphique • Mettre SBU’s / marché • Limites • Subjective (selon le dirigeant) • Limité (facteurs)
Question 2 • La méthode PIMS: • Avantages • Prévision basée sur ROI • Basé sur la profitabilité • Limites • Se base sur les années passées • Modèle inclut un nombre de variables limitées
Question 3 • AHP: • Utilisation algorithme pour déterminer l’importance accordée aux options • Plusieurs critères • Différents niveaux de critères • Comparaison par paires
Question 4 • Subjectivité du jugement amène la distorsion • Possibilité de manipuler la matrice • Interprétation personnelle
Conclusion • Chaque modèle amène des avantages et des désavantages • Outil de support uniquement
Questions ?- ?- ?- ?- ?