Download
1 / 28
280 likes | 396 Views
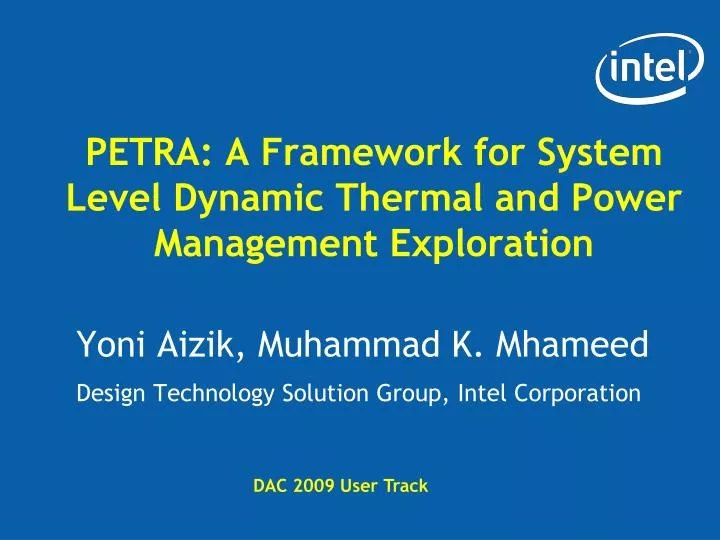
PETRA: A Framework for System Level Dynamic Thermal and Power Management Exploration. Yoni Aizik, Muhammad K. Mhameed Design Technology Solution Group, Intel Corporation. DAC 2009 User Track. Agenda. Power Management - Motivation Overview Usage Examples Summary. Power Management.

E N D
PETRA: A Framework for System Level Dynamic Thermal and Power Management Exploration Yoni Aizik, Muhammad K. Mhameed Design Technology Solution Group, Intel Corporation DAC 2009 User Track
Agenda • Power Management - Motivation • Overview • Usage Examples • Summary
Power Management • Power Performance • Improved performance power • How can we save power and improve performance? • Shut down cores when they are not needed • Wake up cores when the workload increases • Reduce frequency • While making sure that: • The chip does not exceed threshold temperature • The power is sufficiently low
Sleep States • Shut down unneeded core • Idle cores: • Busy resources • No jobs • To save power, idle cores are sent to sleep Idle percentage Wakeup Time Power Sleep state
Frequency Scaling • DVFS: • Higher frequency higher performance, higher power • Lower frequency ≠ lower performance • Decreases frequency when the memory is the bottleneck • To save power, the frequency of the core is reduced to the point that ensures minimum performance degradation frequency
Challenges • System architects have to: • Implement power management algorithms • Consider their mutual influence • Evaluate different implementation options • Evaluation of system level power management requires long benchmarks • Minutes-long applications - Thermal effects, global optimization (not local) • RTL model is not a viable option, due to slow simulation speed • Need early evaluation method • That can run long benchmarks • Enable assessment of different power management algorithms
Petra Objectives • Provide a flexible high-level modeling and simulation framework for power management algorithms and hardware • Enable early assessment of • Power management algorithms/configurations w.r.t. power/performance on real workloads (~minutes) • Various OS policies • Power architects are the target users
Petra Overview • Petra reads application traces • Process traces through power management algorithms implemented by the user • Takes into account dynamic thermal behavior • Reports the power and performance of the simulated application
Input Traces Workload 3Ghz … 1Ghz Applications is run on previous generation CPU Each workload has to be prepared ahead of time Collect data at all supported frequencies
Input Traces Workload Information is arranged in buckets
Energy = a1 · # $ misses + a2 · # int add + … Input Traces Workload Monitor activity of uArch events, map it to energy
Energy = a1 · # $ misses + a2 · # int add + … Input Traces Workload 1 Energy Cdyn = [F] Duration Vcc² ·f
Power Power OS OS Dynamic Simulation Time 1 GHz 2 GHz 3 GHz New Cdyn Freq Change (1Ghz) Idle Period active Period
Power Power Power Power Power Power Power Power execution time ∑energy Dynamic Simulation Time 1 GHz 2 GHz 3 GHz
Input Traces 1Ghz in1 PM 2Ghz in2 data in3 3Ghz sel 4Ghz in4 freq
Traces Building Blocks Cdyn Env Trace Feeder utilization F/S Request Activity OS Agent Power Model Working Point Calculator Power Power WP Request System Frequency Temp HS Temperature Freq, Voltage Thermal Model System Info floorplan System Configuration Working Point Dispatcher Power / WP (Freq, Voltage, Sleep States) Outputs
Traces Building Blocks Cdyn Env Trace Feeder utilization F/S Request Activity OS Agent Power Model Working Point Calculator Power Power WP Request System Frequency Temp HS Temperature Freq, Voltage Thermal Model System Info floorplan System Configuration Working Point Dispatcher Power / WP (Freq, Voltage, Sleep States) Outputs
Traces Building Blocks Cdyn Env Trace Feeder utilization F/S Request Activity OS Agent Power Model Working Point Calculator Power Power WP Request System Frequency Temp HS Temperature Freq, Voltage Thermal Model System Info floorplan System Configuration Working Point Dispatcher Power / WP (Freq, Voltage, Sleep States) Outputs
Traces Building Blocks Cdyn Env Trace Feeder utilization F/S Request Activity OS Agent Power Model Working Point Calculator Power Power WP Request System Frequency Temp HS Temperature Freq, Voltage Thermal Model System Info floorplan System Configuration Working Point Dispatcher Power / WP (Freq, Voltage, Sleep States) Outputs
Traces Building Blocks Cdyn Env Trace Feeder utilization F/S Request Activity OS Agent Power Model Working Point Calculator Power Power WP Request Temp System Frequency HS Temperature Freq, Voltage Thermal Model System Info floorplan System Configuration Working Point Dispatcher Power / WP (Freq, Voltage, Sleep States) Outputs
Traces Building Blocks Cdyn Env Trace Feeder utilization F/S Request Activity OS Agent Power Model Working Point Calculator Power WP Request Power System Frequency Temp HS Temperature Freq, Voltage Thermal Model System Info floorplan System Configuration Working Point Dispatcher Power / WP (Freq, Voltage, Sleep States) Outputs
Traces Building Blocks Cdyn Env Trace Feeder utilization F/S Request Activity OS Agent Power Model Working Point Calculator Power Power WP Request System Frequency Temp HS Temperature Freq, Voltage Thermal Model System Info floorplan System Configuration Working Point Dispatcher Power / WP (Freq, Voltage, Sleep States) Outputs
Traces Building Blocks Cdyn Env Trace Feeder utilization F/S Request Activity OS Agent Power Model Working Point Calculator Power Power WP Request System Frequency Temp HS Temperature Freq, Voltage Thermal Model System Info floorplan System Configuration Working Point Dispatcher Power / WP (Freq, Voltage, Sleep States) Outputs
Usage Example:Performance Impact of Thermal Estimations Errors • Question: How do guard bands used in thermal reading affect the performance of a thermally limited system? • Guard bands are result of: • Thermal sensor errors • Thermal sensor location (proximity to the hotspot) • Each guard band adds performance penalty (over design) • Petra can evaluate this price
Performance Impact of Thermal Estimations Errors • Thermally-stressed system • Proprietary DVFS • Different thermal guard band values • Spec2k • Even few degrees of a thermal guard band lead to a significant performance loss • The data is application dependent • Petra analyses of the tradeoff between the thermal guard bands and performance loss
Cost of Thread Migration • Thread migration: • Move execution between cores • Spread power density • Decrease temperature • Efficiently reduces temp, but adds penalty: • turning-on one core • transfer the µArch state from one core to another • turning off inactive core • High frequency thread migration: • better thermal conditions, but • increasing performance overhead
Cost of Thread Migration • Dual-core system • Running high power application • TM: Temp > 100ºC • DVFS: Temp > 110ºC • Migration frequency is varied • When cycle time > 20mSec, TM is not efficient (the application run-time is constant) • When cycle time < 5mSec, the overhead of the migration is greater than the thermal benefit • The optimal working point : TM cycle time of 10mSec • balance the thermal benefit and the migration overhead
Summary • Petra is a novel simulation framework that estimates the effect of the PM algorithms on real workloads • The abstraction level of the traces enables a reasonable (similar to real) simulation time of target applications • Our solution provides: • Scalability to long benchmark runs • Time accuracy to reflect real system behavior • Separation of algorithm implementation (user provided) and their scheduling (part of infrastructure)