Download
1 / 36
360 likes | 518 Views
IN THE HOT SEAT: Global Climate Change and its effect on us. Udo Fehn University of Rochester. The average temperature across the contiguous United States in 2012 was 55.3° (3.2° above normal). This ranks as the warmest year since records began in 1895.

E N D
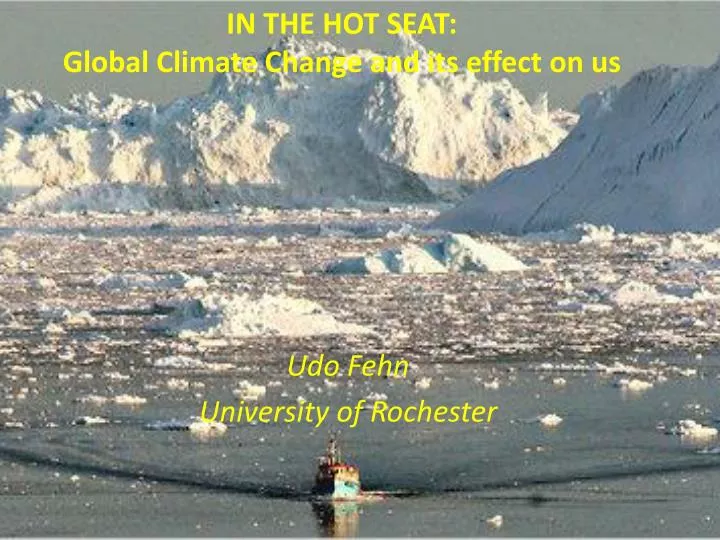
IN THE HOT SEAT:Global Climate Change and its effect on us Udo Fehn University of Rochester
The average temperature across the contiguous United States in 2012 was 55.3° (3.2° above normal). This ranks as the warmest year since records began in 1895. Record-Setting Heat Across the U.S. in 2012 Rochester DEPARTURE FROM NORMAL TEMPERATURES IN 2012 (in oF) +6o +4o +2o 0o -2o Days Below normal Above normal Los Angeles 187 160 Atlanta 118 236 Boston 129 225 Chicago 114 245 Houston 135 221 Source: Accuweather; National Oceanic and Atmospheric Administration New York 127 228 Phoenix 117 241 San Francisco 219 133 Seattle 197 154 Washington 109 247
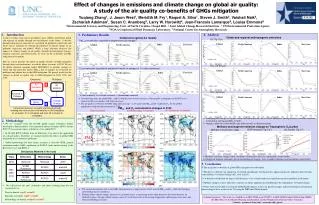
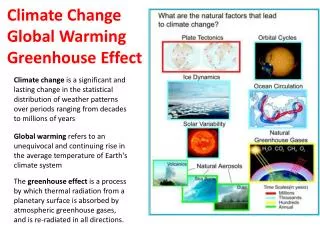
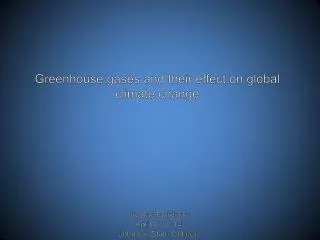
CO2 and Global Warming • What we know for sure: • Release of CO2 (and other gases) from fossil fuel use • Increase of ‘greenhouse gases’ in the atmosphere • What we know with great likelihood: • Temperature increase • Changing weather patterns • Melting of ice (glaciers; sea ice) • What we expect to happen • Changing precipitation pattern • Sea level rise • Changes in ocean currents and wind patterns
Source: Global Climate Change -- Earth Science Communications Team at NASA's Jet Propulsion Laboratory/California Institute of Technology (data from NOAA)
Source: IPCC Working Group I Fourth Assessment Report Summary
The Carbon Cycle This diagram of the fast carbon cycle shows the movement of carbon between land, atmosphere, and oceans in billions of tons of carbon per year. Yellow numbers are natural fluxes, red are human contributions in billions of tons of carbon per year. White numbers indicate stored carbon.
Fuel burning – examples:Coal: C + O2 CO2 Natural Gas: CH4 + 2O2 2H2O + CO2 Where does CO2 end up? ~ 50 % in atmosphere global warming ~50% in oceans ocean acidification
infrared visible ultraviolet
A map of predicted global warming at the end of the 21st century accourding to the HADCM3 climate model with a business-as-usual emissions scenario (IS92a). This model has an average warming of 3.0°
The Intergovernmental Panel on Climate Change's findings on recent changes in temperature, sea level, and snow cover Courtesy IPC Secretarist/World Meteorological Organization
NYSERDA 11-18 From Global to Regional: Consequences for our region
CO2 and Global Warming • What we know for sure: • Release of CO2 (and other gases) from fossil fuel use • Increase of ‘greenhouse gases’ in the atmosphere • What we know with great likelihood: • Temperature increase • Changing weather patterns • Melting of ice (glaciers; sea ice; Great Lakes) • What we expect to happen • Changing precipitation pattern • Sea level rise • Changes in ocean currents and wind patterns
Increase in CO2: Annual cycles small compared to overall increase in CO2 CO2 not a limiting factor for plant growth
Summary • Global Warming is real and will have global consequences • Regional Consequences – Upstate New York • Temperature increase • Longer growing seasons; new crops • Less snow cover, diminished pest kill-off • Appearance of new pests/diseases • Precipitation changes • Influence on growing patterns • Influence on water availability and quality
Sources • Regional – Upstate NY • NYSERDA 11-18 • Union of Concerned Scientists – Global Warming – Regional Studies • A short list of players in the climate debate • Michael Mann • Gavin Schmidt • James Hansen • Bill McKibben • Stephen McIntyre