Download
1 / 46
470 likes | 1.12k Views
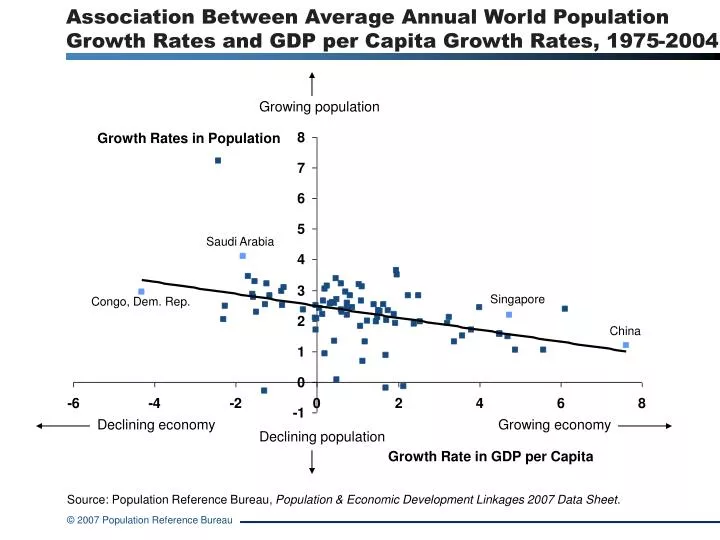
Association Between Average Annual World Population Growth Rates and GDP per Capita Growth Rates, 1975-2004 Growing population Growth Rates in Population Saudi Arabia Singapore Congo, Dem. Rep. China Declining economy Growing economy Declining population Growth Rate in GDP per Capita

E N D
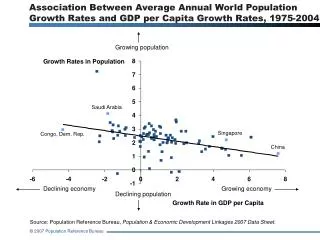
Association Between Average Annual World Population Growth Rates and GDP per Capita Growth Rates, 1975-2004 Growing population Growth Rates in Population Saudi Arabia Singapore Congo, Dem. Rep. China Declining economy Growing economy Declining population Growth Rate in GDP per Capita Source: Population Reference Bureau, Population & Economic Development Linkages 2007 Data Sheet.
Notes on Association Between Average Annual World Population Growth Rates and GDP per Capita Growth Rates Globally, a higher rate of population growth is associated with a lower rate of economic growth, but the association varies across regions and income levels.
Association Between Average Annual Growth Rates in Population and GDP per Capita, Africa, 1975-2004 Growing population Population Growth Rate Botswana Sierra Leone Lesotho Declining economy Growing economy Declining population GDP per Capita Growth Rate Source: Population Reference Bureau, Population & Economic Development Linkages 2007 Data Sheet.
Association Between Average Annual Growth Rates in Population and GDP per Capita, Asia, 1975-2004 Growing population Population Growth Rate Kuwait Malaysia China Declining economy Growing economy Declining population GDP per Capita Growth Rate Source: Population Reference Bureau, Population & Economic Development Linkages 2007 Data Sheet.
Association Between Average Annual Growth Rates in Population and GDP per Capita, Europe, 1975-2004 Growing population Population Growth Rate Albania Slovenia Moldova Declining economy Growing economy Declining population GDP per Capita Growth Rate Source: Population Reference Bureau, Population & Economic Development Linkages 2007 Data Sheet.
Association Between Average Annual Growth Rates in Population and GDP per Capita, Latin America, 1975-2004 Growing population Population Growth Rate Nicaragua Dominican Republic Trinidad and Tobago Declining economy Growing economy Declining population GDP per Capita Growth Rate Source: Population Reference Bureau, Population & Economic Development Linkages 2007 Data Sheet.
Use of Modern Contraception by Wealth Married Women Ages 15-49 Using Modern Contraception Percent Source: Population Reference Bureau, Population & Economic Development Linkages 2007 Data Sheet.
Notes on Use of Modern Contraception by Wealth Across the world, poor women use contraceptives at lower rates than wealthier women. However, strong family planning efforts can increase use of contraceptives in all wealth groups, even in low-income countries such as Bangladesh.
Use of Modern Contraception by Education Married Women Ages 15-49 Using Modern Contraception Percent Source: ORC Macro, Demographic and Health Surveys.
Use of Modern Contraception by Place of Residence Married Women Ages 15-49 Using Modern Contraception Percent Source: ORC Macro, Demographic and Health Surveys.
Child Mortality by Wealth Deaths Under Age 5 per 1,000 Live Births Source: Population Reference Bureau, Population & Economic Development Linkages 2007 Data Sheet.
Notes on Child Mortality by Wealth The mortality rate of children under age 5 varies between the wealthy and the poor in a country. People in lower wealth groups face more risk of their children dying than those in wealthier groups.
Child Mortality by Place of Residence Deaths Under Age 5 per 1,000 Live Births Source: ORC Macro, Demographic and Health Surveys.
Infant Mortality by Wealth Deaths Under Age 1 per 1,000 Live Births Source: ORC Macro, Demographic and Health Surveys.
Association Between Fertility and Education Percent of Girls Enrolled in Secondary School Uruguay Palestinian Territory Morocco Total Fertility Rate Source: Population Reference Bureau, Population & Economic Development Linkages 2007 Data Sheet.
Notes on Association Between Fertility and Education The share of secondary school age girls who are enrolled in school tends to be higher in countries with lower fertility rates.
Total Fertility Rate by Wealth Average Number of Children Born to a Woman During Her Lifetime Source: ORC Macro, Demographic and Health Surveys.
Total Fertility Rate by Education Average Number of Children Born to a Woman During Her Lifetime Source: ORC Macro, Demographic and Health Surveys.
Association Between Fertility and Poverty Percent of Population Living on <$2 per Day Niger Mongolia Jordan Total Fertility Rate Source: Population Reference Bureau, Population & Economic Development Linkages 2007 Data Sheet.
Notes on Association Between Fertility and Poverty Countries with a higher percentage of people living in poverty often have higher fertility rates.
Unmet Need for Family Planning by Wealth Women with Unmet Need for Family Planning Percent Source: Population Reference Bureau, Population & Economic Development Linkages 2007 Data Sheet.
Notes on Unmet Need for Family Planning By Wealth The poorest people often have the highest unmet need for family planning services. However, in some countries, such as Ethiopia, the poorest may have low unmet need because they desire large families. In countries with strong family planning programs, such as Colombia, unmet need for family planning is relatively low, especially when compared to neighboring countries. Women have an unmet need for family planning if they are married women of reproductive age (ages 15 to 49) who say they do not want more children or want to wait two or more years to have another child, yet are not using contraception.
Period of Potential Demographic Bonus Source: Population Reference Bureau, Population & Economic Development Linkages 2007 Data Sheet.
Notes on Period of Potential Demographic Bonus Countries with increasing numbers of working-age adults relative to dependent elderly and children have an opportunity to increase employment, investment, and savings. This potential economic advantage in growth and well-being is called a demographic bonus. This graph shows the time period in which selected countries can realize this bonus. Whether or not the demographic bonus is realized depends on economic policies and the creation of economic opportunities.
Trends in Number of Working-Age Adults per Dependent Number of Working-Age Adults (Ages 15-64) per Dependent (Under Age 15 and Ages 65 and Over) Source: United Nations, World Population Prospects: The 2004 Revision, 2005.
Association Between Fertility and Female Labor Force Participation Female Labor Force Participation Rate 2004 Djibouti Philippines Turkey Total Fertility Rate 2000-2004 Source: United Nations, World Population Prospects: The 2004 Revision, 2005; International Labor Organization, Yearbook of Labor Statistics 2006.
Notes on Association Between Fertility and Female Labor Force Participation Female labor force participation tends to be higher in countries with lower fertility rates.
Adolescent Pregnancy and Motherhood by Wealth Women Ages 15-19 Who Are Mothers or Pregnant with Their First Child Percent Source: ORC Macro, Demographic and Health Surveys.
Adolescent Pregnancy and Motherhood by Education Women Ages 15-19 Who Are Mothers or Pregnant with Their First Child Percent Source: ORC Macro, Demographic and Health Surveys.
Adolescent Pregnancy and Motherhood by Place of Residence Women Ages 15-19 Who Are Mothers or Pregnant with Their First Child Percent Source: ORC Macro, Demographic and Health Surveys.
Delivery Assistance by Place of Residence Births Attended by a Doctor or Other Health Professional Percent Source: ORC Macro, Demographic and Health Surveys.
Inequalities in Health Status Latest Surveys 1990-2002 Average ratio of the rate in poorest quintile to rate in richest quintile 56 countries 45 countries 50 countries Note: Averages are not weighted for population size. * BMI<18.5, defined as weight in kilograms divided by the square of height in meters. ** Low height for age in relation to an international reference population of well-nourished children. Source: D.R. Gwatkin, S. Rutstein, K. Johnson, E.A. Suliman, and A. Wagstaff, Initial Country-Level Information about Socioeconomic Differences in Health, Nutrition, and Population, Volumes I and II (Washington, DC: The World Bank, November 2003).
Life Expectancy at Birth 2000-2005 Years Note: More developed regions, according to the UN Population Division, include Australia, New Zealand, Europe, North America, and Japan. Less developed regions include Africa, Asia (excluding Japan), and Latin America and the Caribbean; 50 countries within these regions are classified as least developed. Source: United Nations Population Division, World Population Prospects: The 2004 Revision, 2005.
Childhood Mortality Among the Poor Poorest Economic Quintile Deaths under age 5 per 1,000 births Source: ORC Macro, Demographic and Health Surveys.
Adolescent Fertility Rate Births per 1,000 Women Ages 15-19 Source: D.R. Gwatkin, S. Rutstein, K. Johnson, E.A. Suliman, and A. Wagstaff, Initial Country-Level Information about Socioeconomic Differences in Health, Nutrition, and Population, Volumes I and II (Washington, DC: The World Bank, November 2003).
Fertility Among Poorer and Wealthier Women Total Fertility Rate Source: D.R. Gwatkin, S. Rutstein, K. Johnson, E.A. Suliman, and A. Wagstaff, Initial Country-Level Information about Socioeconomic Differences in Health, Nutrition, and Population, Volumes I and II (Washington, DC: The World Bank, November 2003).
Spousal Violence Women Who Have Ever Experienced Spousal Violence Percent Source: D.R. Gwatkin, S. Rutstein, K. Johnson, E.A. Suliman, and A. Wagstaff, Initial Country-Level Information about Socioeconomic Differences in Health, Nutrition, and Population, Volumes I and II (Washington, DC: The World Bank, November 2003).
Inequalities in the Use of Health Services Surveys 1992-2001 Average rich/poor ratio 47 countries 50 countries 53 countries 42 countries 53 countries Note: Represents the average of the ratios of the richest quintile to poorest quintile, not weighted for population size and excluding countries with use less than 1 percent. Source: D.R. Gwatkin, S. Rutstein, K. Johnson, E.A. Suliman, and A. Wagstaff, Initial Country-Level Information about Socioeconomic Differences in Health, Nutrition, and Population, Volumes I and II (Washington, DC: The World Bank, November 2003).
Childhood Vaccination Coverage Children 12-23 Months Receiving Full Basic Coverage Percent Source: ORC Macro, Demographic and Health Surveys.
Contraceptive Users Who Obtain Supplies and Services From a Public Sector Program Married Women Users Percent Source: D.R. Gwatkin, S. Rutstein, K. Johnson, E.A. Suliman, and A. Wagstaff, Initial Country-Level Information about Socioeconomic Differences in Health, Nutrition, and Population, Volumes I and II (Washington, DC: The World Bank, November 2003).
Delivery Assistance Among Women Poorest Economic Quintile Percent of births attended by skilled personnel Source: ORC Macro, Demographic and Health Surveys.
Births Attended by Skilled Personnel: Progress Mixed Percent Source: D.R. Gwatkin, S. Rutstein, K. Johnson, E.A. Suliman, and A. Wagstaff, Initial Country-Level Information about Socioeconomic Differences in Health, Nutrition, and Population, Volumes I and II (Washington, DC: The World Bank, November 2003).
Women Who Decide by Themselves to Seek Health Care Women Ages 15-49 Percent Note: Includes only those women who say that they alone have the final say in decisions to obtain their own health care. Source: D.R. Gwatkin, S. Rutstein, K. Johnson, E.A. Suliman, and A. Wagstaff, Initial Country-Level Information about Socioeconomic Differences in Health, Nutrition, and Population, Volumes I and II (Washington, DC: The World Bank, November 2003).
Outliers: Vietnam, Egypt, and Kazakhstan Percent Source: D.R. Gwatkin, S. Rutstein, K. Johnson, E.A. Suliman, and A. Wagstaff, Initial Country-Level Information about Socioeconomic Differences in Health, Nutrition, and Population, Volumes I and II (Washington, DC: The World Bank, November 2003).
Health Expenditure Per Capita 2003 US$ Note: Low-income countries are classified as having a per capita GNI of US$825 or less. Lower-middle-income countries are classified as having a per capita GNI of US$826 to US$3255. Upper-middle-income countries are classified as having a per capita GNI of US$3256 to US$10,065. High-income countries are classified as having a per capita GNI of US$10,066 or greater. Source: World Bank, World Development Indicators 2006.
Population Living on Less Than US$2 per Day 2002 Percent Source: World Bank, World Development Indicators 2006.