Download
1 / 10
100 likes | 154 Views
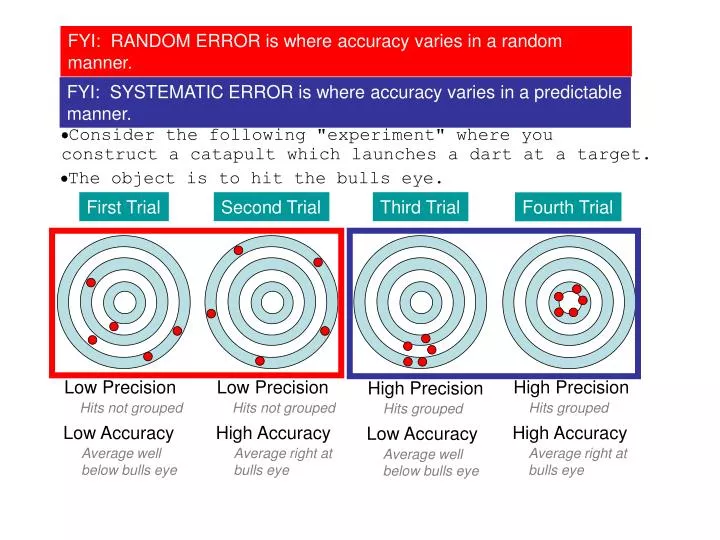
FYI: RANDOM ERROR is where accuracy varies in a random manner. FYI: SYSTEMATIC ERROR is where accuracy varies in a predictable manner. Topic 1.2 Extended B - Laboratory number crunching. Consider the following "experiment" where you construct a catapult which launches a dart at a target.

E N D
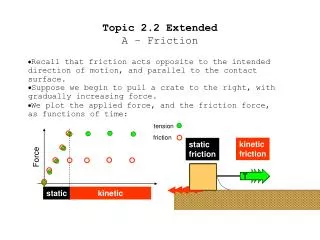
FYI: RANDOM ERROR is where accuracy varies in a random manner. FYI: SYSTEMATIC ERROR is where accuracy varies in a predictable manner. Topic 1.2 ExtendedB - Laboratory number crunching Consider the following "experiment" where you construct a catapult which launches a dart at a target. The object is to hit the bulls eye. First Trial Second Trial Third Trial Fourth Trial Low Precision Low Precision High Precision High Precision Hits not grouped Hits not grouped Hits grouped Hits grouped Low Accuracy High Accuracy High Accuracy Low Accuracy Average well below bulls eye Average right at bulls eye Average right at bulls eye Average well below bulls eye
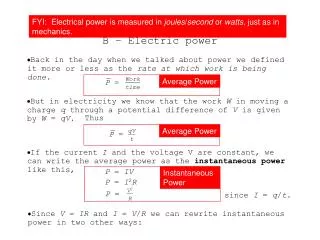
0 1 1 cm 1 mm FYI: This is the precision in a SINGLE measurement. Topic 1.2 ExtendedB - Laboratory number crunching Having gathered your data (recorded to the most significant figures allowed by your measuring devices), you will want to analyze your data, and somehow decide on its validity. We have already talked of precision. For our meter stick we could measure to 3 significant figures with a precision of ± 0.05 mm: I estimate the length to be 1.17 cm or 11.7 mm. Considering error, L = 11.7 mm ± .05 mm. We call the precision of 0.05 mm the absolute error.
Fractional Error 0.05 11.7 Fractional Error = ·100% FYI: FRACTIONAL ERROR is a way to evaluate the ACCURACY of a measurement. FYI: Note that the SMALLER the MEASURED VALUE, the LARGER the FRACTIONAL ERROR. Topic 1.2 ExtendedB - Laboratory number crunching There are three useful percent formulas: FYI: FRACTIONAL ERROR between 1% and 5% are considered fairly accurate. Less than 1% is very accurate, and greater than 10% is considered "rough." The first formula compares absolute error to a measured value: Absolute Error Measured Value ·100% Fractional Error = For example, since we measured L = 11.7 mm ± .05 mm, we have Fractional Error = 0.43%
Percent Difference x1 - x2 (x1+ x2) 1 2 11.7 - 11.8 (11.7+11.8) 1 2 FYI: PERCENT DIFFERENCE is a way to evaluate the PRECISION in your measurements- provided they are expected to be the same. Topic 1.2 ExtendedB - Laboratory number crunching There are three useful percent formulas: The second formula compares two measured values x1and x2: Difference Average ·100% Percent Difference = % Diff = ·100% For example, suppose you measure the line of the previous example to be x1 = 11.7 mm the first time, and x2 = 11.8 mm the second time. % Diff = ·100% % Diff = 0.851%
Percent Error xmeas - xtrue xtrue % Err = ·100% 3.11 - 3.14 3.14 % Error = ·100% FYI: PERCENT ERROR is a way to evaluate the ACCURACY in your measurements- provided you know what they are supposed to be. Topic 1.2 ExtendedB - Laboratory number crunching There are three useful percent formulas: The third formula compares a measured valuexmeasto an accepted or "true" valuextrue: Difference True Value ·100% Percent Error = For example, suppose you measure the diameter and circumference of a circle, and calculate pi to be 3.11. % Err = 0.955%
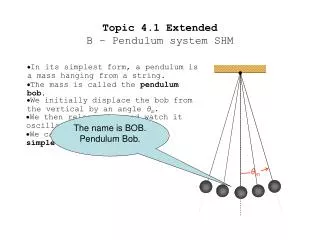
Bob's Data Abby's Data Average or Mean Bob a = 10 ms-2 a = 10 ms-2 Abby x = a = a = Topic 1.2 ExtendedB - Laboratory number crunching Sum of Values Number of Values Who's lab results are best - Bob's or Abby's? Average Value = Suppose another student has this data for the same experiment: We will learn that all freely falling objects should have a CONSTANT acceleration. So we find the average, or mean value of the data. Sometimes you have lots of data that you need to compare to a known value: For example, suppose you measure the freefall acceleration of a dropped ball. N 1 N xi i=1 0 + 2 + 10 + 18 + 20 5 0 + 10 + 10 + 10 + 20 5
Abby's Data Bob's Data Range Range Range a a Topic 1.2 ExtendedB - Laboratory number crunching At first glance we may say the results are identical: After all, both have the same average acceleration of 10 m/s2. So how do we distinguish between the data sets (preferably with a single number)? One way is by examining the range of the data points. But instinctively, you may feel that Abby's data is better, because, after all, three of the data points are exactly equal to the average acceleration. Range = Max(xi)- Min(xi) These data sets each have the same range (spread) of 20 m/s2 - 0 m/s2 = 20 m/s2. In technical terms, both data sets have the same ACCURACY, but Abby's data set has better PRECISION. Thus range isn't the best indicator of a data set's precision.
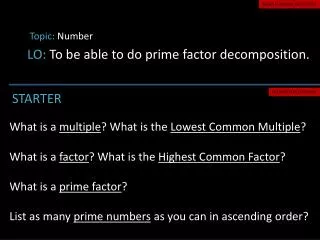
Abby's Data Bob's Data Deviation from the Mean ith deviation = (xi - x) a a FYI: The ith deviation only tells you how precise a SINGLE data point is. To find the PRECISION of the data SET, you might find the AVERAGE of all of the deviations. But the average in both cases is ZERO! Topic 1.2 ExtendedB - Laboratory number crunching -10 + -8 + 0 + 8 + 10 5 -10 + 0 + 0 + 0 + 10 5 10 10 8 = 0 ms-2 = 0 ms-2 0 0 0 0 - 10 - 8 - 10 Another indicator of precision is deviationfrom the mean:
Abby's Data Bob's Data Average AbsoluteDeviation from the Mean 1 N average absolute deviation = |xi - x| a a Topic 1.2 ExtendedB - Laboratory number crunching 10 + 8 + 0 + 8 + 10 5 10 + 0 + 0 + 0 + 10 5 10 10 8 = 7.2 ms-2 = 4 ms-2 0 0 0 0 10 8 10 A way around this unfortunate circumstance is to take the AVERAGE OF THE ABSOLUTE VALUES of the deviations: Now we have an indicator (in the form of a single number) which tells us that Abby's data is better than Bob's.
Abby's Data Bob's Data StandardDeviation a a 1 N-1 standard deviation = =(xi - x)2 FYI: The standard deviation as the square root of the average of the squares of the deviations. Topic 1.2 ExtendedB - Laboratory number crunching (-102) + (-82) + 02 + 82 + 102 5-1 (-10)2 + 02 + 02 + 02 + 102 5-1 10 10 8 = 9.1 ms-2 = 7.1 ms-2 0 0 0 0 -10 -8 -10 FYI: For reasons we don't need to go into, we divide by ONE LESS THAN THE TOTAL NUMBER OF DATA POINTS when finding this average. FYI: Squaring the deviations produces POSITIVE values, just like the absolute value. Because absolute values are tedious (you have to take the opposite of negative differences), standard deviation is the accepted way to determine precision: