Download
1 / 25
250 likes | 334 Views
This presentation will probably involve audience discussion, which will create action items. Use PowerPoint to keep track of these action items during your presentation In Slide Show, click on the right mouse button Select “Meeting Minder” Select the “Action Items” tab

E N D
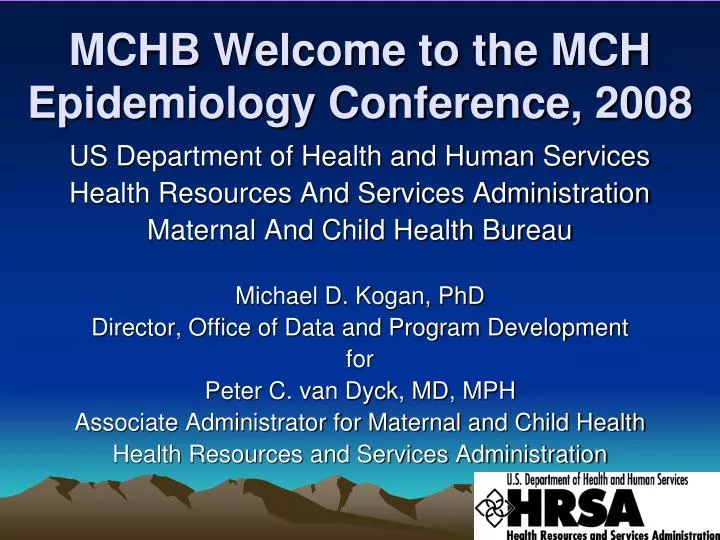
This presentation will probably involve audience discussion, which will create action items. Use PowerPoint to keep track of these action items during your presentation • In Slide Show, click on the right mouse button • Select “Meeting Minder” • Select the “Action Items” tab • Type in action items as they come up • Click OK to dismiss this box • This will automatically create an Action Item slide at the end of your presentation with your points entered. MCHB Welcome to the MCH Epidemiology Conference, 2008 US Department of Health and Human Services Health Resources And Services Administration Maternal And Child Health Bureau Michael D. Kogan, PhD Director, Office of Data and Program Development for Peter C. van Dyck, MD, MPH Associate Administrator for Maternal and Child Health Health Resources and Services Administration
MCH Epidemiology: 2000-2007 • The number of registrants at the MCH epidemiology conference grew from 400 to 533. • Number of presentations, trainings and meetings at the MCH epidemiology conference have grown. • The number of CDC/HRSA MCH epidemiology state assignees grew from one (in 1987) to twelve.
MCH Epidemiology: 2000-2007 • MCH epidemiology had the second greatest increase in state-based epidemiologists (after bioterrorism) • The number increased from 106 to 171. • The percent of states able to provide substantial to full capacity in MCH epidemiology increased from 35% (in 2001) to 52% (in 2006).
MCH Epidemiology: 2000-2008 • Almost 350 people have been trained in epidemiology methods through the HRSA/CDC course in MCH epidemiology. (Next year’s class will be in Tampa, FL from May 17-21). • Another 400-600 have received the AMCHP two day trainings before the MCH Epidemiology Conference.
MCH Epidemiology: 2000-2007 • The number of submissions to the MCH Journal has increased from 74 to 200.
MCH Epidemiology: 2000-2007 • The number of articles in 8 US public health journals mentioning “preterm” has increased from 46 to 80. • The number of articles mentioning “birth weight” has increased from 94 to 125.
Planning Committee Voting to Move Conference out of Atlanta Next Year
MCH Epidemiology: 2000-2007 • The MCHB Block grant has changed from $709 million to $693 million. It is now at its 1993 level.
Rate of Cesarean Delivery100 BC - 2006 Menacker et al, Seminars in Perinatology, 2006; NVSS, 2004-2006
Percent Preterm Births in the US,1990-2006 Source; National Vital Statistics System, NCHS, CDC, 1990-2006
Percent Low Birth Weight Births in the US, 1990-2006 Source; National Vital Statistics System, NCHS, CDC, 1990-2006
National Survey of Children with Special Health Care Needs, 2005-2006 • Measures and Tracks Prevalence of CSHCN • Nationally • By State • Describes Demographic Characteristics • Other Measures Include • Functional Limitations • Health Care Access • Needs and Satisfaction with Care • Burden and Impact on Family
Prevalence of CSHCN: State Variation 5 Highest and 5 Lowest Prevalence States CSHCN Prevalence
Reduce/Stop Work Because of Child’s Care and =>10 Hours Providing Care Source: 2005-6 National Survey of CSHCN
Health Insurance Coverage Percentage of CSHCN, by Type of Health Insurance 2001 2001* 2006
National Survey of Children’s Health, 2007 • Purpose: To produce national and State-based estimates on the health and well-being of children, their families, and their communities • Sample: Independent random-digit-dial samples for all 50 States and the District of Columbia (DC) of over 90,000 children
Insurance coverage consistency and adequacy Medical home Child care arrangements Reading for pleasure Television watching Home alone (6-11) Working for pay (12-17) Volunteering (12-17) Weekly attendance at religious services School enrollment and engagement Participation in activities outside of school Repeating a grade Parents’ health status Parenting aggravation Smoking in the household Neighborhood amenities, condition, and social support Child’s safety in neighborhood and at school NSCH Topic Areas
Release of 2007 NSCH Data • February or March 2009 • Public use microdata files • Extensive documentation • Online data query system • http://www.childhealthdata.org
National Survey of Children with Special Health Care Needs, 2009 The third round will be going into the field early in 2009
The Title V Block Grant 5 Year Needs Assessment . Next 5 Year Needs Assessment will be due in July 2010. . New guidance for Block Grant will be issued this Spring. Technical assistance on capacity assessment for State MCH/CSHCN Directors is planned for February 25-26.
Contact Michael D. Kogan, PhD HRSA/MCHB Director, Office of Data and Program Development mkogan@hrsa.gov