Download
1 / 43
430 likes | 527 Views
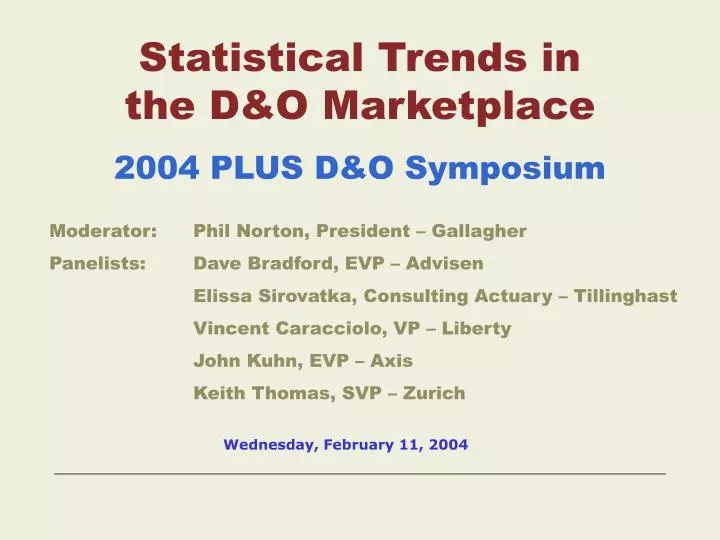
Statistical Trends in the D&O Marketplace 2004 PLUS D&O Symposium. Moderator: Phil Norton, President – Gallagher Panelists: Dave Bradford, EVP – Advisen Elissa Sirovatka, Consulting Actuary – Tillinghast Vincent Caracciolo, VP – Liberty John Kuhn, EVP – Axis

E N D
Statistical Trends in the D&O Marketplace 2004 PLUS D&O Symposium Moderator: Phil Norton, President – Gallagher Panelists: Dave Bradford, EVP – Advisen Elissa Sirovatka, Consulting Actuary – Tillinghast Vincent Caracciolo, VP – Liberty John Kuhn, EVP – Axis Keith Thomas, SVP – Zurich Wednesday, February 11, 2004
Session Outline • Introduction • Class Action Trends Segway • Premium Trends • Trends in Retention of Risk • Coverage Issues • Underwriter Focus • Capacity
The Post-PSLRA Dynamic • The cost of “doing business” is suddenly up 40% • Entity coverage works but some clients become less interested in their litigation • The backlog of cases mount • Significant losses become a reality • Carrier reserves were inadequate • But market holds onto excess capacity as competing carriers are slow to recognize losses and increase reserves (and prices!) • Loss ratios fall out of the money – far out!
The “Not So Perfect” D&O Storm • D&O insurers continue to be concerned about their reserves for D&O losses; key drivers for the hard market have been: Increased Severity of Claims - including Mega claim settlements Increased Frequency of Claims - legal costs rising dramatically Reinsurance Market Issues - effectively decreasing market capacity Financial Scandals - adding fuel to the fire!
2003 Tillinghast D&O Survey • 2,068 U.S. companies responding (and 71 Canadian) • 15 business classes, with largest representation from technology, biotechnology & pharmaceuticals • About 14% of the U.S. participants have over $1 billion in assets, and about 42% are publicly traded • Measuring D&O trends since 1973
2003 Tillinghast D&O Survey Results Signs of Continuing Hard Market Conditions • Premiums increased significantly • Policy limits stable for most, but small decrease on average • Deductibles/retentions level or increasing • Enhancements taken away • Exclusions still an issue • Capacity declined
Session Outline • Introduction • Class Action Trends Segway • Premium Trends • Trends in Retention of Risk • Coverage Issues • Underwriter Focus • Capacity
D&O Class Actions • Frequency – Reasonably Level • 212 in 2003 • “Adjusted” prior 5-year average of 211 • Severity • D&O Claim Costs have tripled since 1997, with sources such as Cornerstone Research estimating average securities claim costs in the range of $25 million. • “Mega-claims” are the new reality
Cendant Corp. $2.83 Billion WorldCom $750 Million Lucent Technologies $631 Million Bank of America $490 Million Waste Management 2 $457 Million Oxford Health Plans $300 Million Daimler Chrysler $300 Million 3com $259 Million Computer Associates 1 $230 Million Waste Management 1 $220 Million Rite Aid $200 Million Digex $165 Million Dollar General $162 Million American Continental $157 Million Dayton Power & Light $146 Million Rexene $145 Million Informix $142 Million Computer Associates 2 $135 Million Sunbeam $125 Million Mattel $122 Million Conseco $120 Million Philip Morris $116 Million IKON Office Solutions $111 Million Prison Realty Trust $104 Million MicroStrategy $103 Million *Estimates may be subject to change Recent Large D&O Claim Settlements*
The Undiscovered Country • Hundreds of open claims may be typical, but • 45 • Claims alleging damages in excess of $1 billion!
Session Outline • Introduction • Class Action Trends Segway • Premium Trends • Trends in Retention of Risk • Coverage Issues • Underwriter Focus • Capacity
Defying Gravity Insurer Operating Ratio Cost of Risk Source: A.M. Best, Advisen/RIMS Benchmark Survey Database
Average Annual Tillinghast D&O Premium Index Increased 33% 50% 40% 30% 20% Median Average 10% 0% -10% -20% 1995 1996 1997 1998 1999 2000 2001 2002 2003 Median is increasing less than average implying that some organizations were hit with much greater premium increases.
Premiums were up for all classes, including private company and not-for-profit sectors Changes in Premium from Prior Year U.S. Canada Increased Decreased Same 70% 20% 10% 89% 7% 4% Majority of participants reported increases in premium during the second half of 2002 and first half of 2003 Source: Tillinghast 2003 D&O Survey
Premium Trends • 33% @ 42% => 80% • 135,115,50,25 => 80% • 3 Years Worth => 5.2X
Typical D&O Percentage Increases Publicly Traded Companies
A Market on the Verge of Change Source: Advisen/RIMS Benchmark Survey Database
A Market on the Verge of Change Source: Advisen/RIMS Benchmark Survey Database
A Market on the Verge of Change Source: Advisen/RIMS Benchmark Survey Database
Session Outline • Introduction • Class Action Trends Segway • Premium Trends • Trends in Retention of Risk • Coverage Issues • Underwriter Focus • Capacity
Risk Transfer was Stable Quarter Increased Decreased Same Changes in Limits by Quarter— U.S. Third Quarter 2002 Fourth Quarter 2002 First Quarter 2003 Second Quarter 2003 Third Quarter 2003 Total 16% 12% 13% 12% 13% 13% 16% 20% 13% 12% 13% 14% 69% 68% 74% 76% 74% 73% For the most part, insureds maintained their policy limits. Source: Tillinghast 2003 D&O Survey
Retentions Continued to Rise Changes in Retentions by Quarter — U.S. Quarter Increased Decreased Same Third Quarter 2002 Fourth Quarter 2002 First Quarter 2003 Second Quarter 2003 Third Quarter 2003 Total 55% 58% 45% 38% 27% 44% 20% 11% 15% 11% 11% 13% 25% 30% 40% 51% 61% 43% But fewer and fewer insureds are reporting increases in deductibles/retentions since the 4th quarter of 2002. Source: Tillinghast 2003 D&O Survey
Another View of Changes in Retentions Source: Advisen/RIMS Benchmark Survey Database
Session Outline • Introduction • Class Action Trends Segway • Premium Trends • Trends in Retention of Risk • Coverage Issues • Underwriter Focus • Capacity
Enhancements Difficult to Maintain Changes in Enhancements by Survey Year Increase Decrease 0 0 Source: Tillinghast 2003 D&O Survey Continued evidence of coverage roll backs, but not as bad as previous year.
Exclusions Still an Issue Changes in Exclusions by Survey Year Increase Decrease 14% 7% Source: Tillinghast 2003 D&O Survey Nearly one in five insureds saw the imposition of additional exclusions.
The Hard Market Good News • Coverage “take-aways” were not as severe as in the previous hard market • Major issues revolve around: • Entity Coverage versus Pre-determined Allocation • Discovery Clause restrictions • War, Terrorism or even Mold exclusions • Deletion of retention waivers • Lower automatic subsidiary coverage thresholds • Severability
Overall D&O Coverage Trends Norton-Bastian D&O Coverage Index
Risk Financing Alternatives • Large Deductible Programs • A-side Only • Blending A-side only and full coverage • Blending D&O with other lines of coverage • Group Captive formation • Finite Risk • Self Insurance — including Indemnification Trusts, Single Parent Captive, and Financial Markets Vehicles
“A-side” Alternatives to consider • All Side-A Program • Very rare because they are not cost effective • Side-A excess over full coverage • Vanilla products are ok (unless you asked for chocolate!) • Side-A “excess & DIC” over full coverage • Delivers quality – but at a price • Independent Directorship Liability • Often too much money to not insure “the buyer”
Session Outline • Introduction • Class Action Trends Segway • Premium Trends • Trends in Retention of Risk • Coverage Issues • Underwriter Focus • Capacity
The Market Is Not Differentiating Among Risks Polices rated by insurer pricing schedule Actual market pricing of same policies Source: Advisen/RIMS Benchmark Survey Database
The Market Is Not Differentiating Among Risks Normalized Primary Premium/Revenue to ISS Industry CGQ 0.3 0.2 0.1 0.0 Premium/ Revenue 0 10 20 30 40 50 60 70 80 90 100 ISS Industry CGQ Source: ISS, Advisen/RIMS Benchmark Survey Database
The Market Is Not Differentiating Among Risks Normalized Primary Premium/Revenue to Board Analyst Board Effectiveness Rating 0.3 0.2 0.1 0.0 Premium/ Revenue D C B A Board Effectiveness Rating Source: Corporate Library, Advisen/RIMS Benchmark Survey Database
Well, Maybe a Little... Normalized Primary Premium/Revenue to S&P Credit Rating 0.10 0.05 0.000 Premium/ Revenue B- B+ BB BBB- BBB+ A AA- S&P Rating Source: Standard & Poor’s, Advisen/RIMS Benchmark Survey Database
Well, Maybe a Little... Median Primary Policy Premium to Median SCAS Pure Premium 800 700 600 Consumer Disc Consumer Stap Financials Health Care Industrials IT Materials Telecom Utilities Median Policy Premium ($000) 500 400 300 200 100 0 100 200 300 400 500 Median Pure Premium ($000) Source: ISS, Advisen/RIMS Benchmark Survey Database
Session Outline • Introduction • Class Action Trends Segway • Premium Trends • Trends in Retention of Risk • Coverage Issues • Underwriter Focus • Capacity
Capacity Declined in 2003 to the Lowest Level Since 1997 Full Limits Capacity (in millions) — U.S., For-Profit Only (Source: Tillinghast)
The Reinsurance Market • Still Difficult: • Initially driven by the 9/11 tragedy • Renewals are newsworthy • Aggregation concerns - will it happen again? • Insurer vs. reinsurer loss ratios • More intrusion and restrictions; fewer exceptions • More net lines translates into: • => more Caution with limits offered • => => an effective reduction in capacity • => => => less competition
Calm in the Storm? - New Capacity • Brokers maintaining 47 D&O carrier relationships, including several newer ones • $300 million capacity is readily available for a difficult risk and much more for a better risk • But carriers still very reluctant to use their full capacity on most risks
Changes in Market Players Traditional D&O underwriters losing share… …while new entrants grow in significance Source: Advisen market data
“Please Lord, give me another hard market. I promise not to blow it this time.” Sign on underwriter’s desk, circa 1989