Download
1 / 15
150 likes | 276 Views
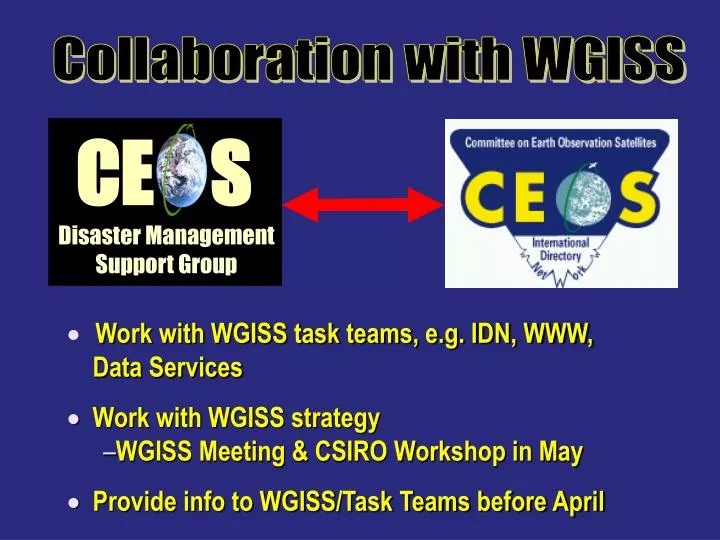
CE S. Disaster Management Support Group. Collaboration with WGISS. Work with WGISS task teams, e.g. IDN, WWW, Data Services Work with WGISS strategy WGISS Meeting & CSIRO Workshop in May Provide info to WGISS/Task Teams before April. Collaboration with WGISS.

E N D
CE S Disaster Management Support Group Collaboration with WGISS • Work with WGISS task teams, e.g. IDN, WWW, Data Services • Work with WGISS strategy • WGISS Meeting & CSIRO Workshop in May • Provide info to WGISS/Task Teams before April
Collaboration with WGISS • Approach--DMSG define requirements & pass on to WGISS • WGISS can better understand scope of our problem • Different from current WGISS scenarios (“use cases”)? • Some differences (my preliminary perception) • Many DMSG “use cases” high level, poorly defined • Often users doesn’t know what they need • Requirements are diverse • Requirements are often specialized • Users speak a different language DMSG requirements very different, I believe!! Opportunity & challenge for WGISS & DMSG
Hazard Team Recommendations Some Recurring Themes Integrated satellite/in-situ data sets - Models - GIS/SDI Improved communications--networks Compelling demonstrations--fire,flood,…. Global data bases--accreditation/standardization - E.g. DEM (~1m vertical resolution) Global systems
fuel maps dead fuel moisture detection monitoring biomass burning fire extent
T E A M R E Q U I R E M E N T S Flood
Geostationary and Polar Weather Satellite Spatial and Temporal Requirements For Flash Floods Threshold Optimum Channels Spatial Temporal Spatial Temporal VIS 1 km 1 hr 1 km 5 min 3.9 micron 4 km 1 hr 1 km 5 min 6.7 micron 8 km 1 hr 1 km 5 min 10.7 micron 4 km 1 hr 1 km 5 min 12.0 micron 4 km 1 hr 1 km 5 min 85.5 GHz 15 x 13 km 12 hr 10 x 10 km 15 min 37.0 GHz 37 x 28 km 12 hr 10 x 10 km 15 min 22.2 GHz 50 x 40 km 12 hr 10 x 10 km 15 min 19.3 GHz 69 x 43 km 12 hr 10 x 10 km 15 min
Spatial Resolution Requirements By Application Application Phase Threshold Optimum Sensor Type Land Use Pre-flood 30 m 4-5 m MSI Post-flood Infrastructure Pre-flood 5 m <= 1 m PanVisStatus Post-flood Vegetation Pre-flood <= 250 m <= 30 m MSI/HIS Post-flood Soil Moisture Pre-flood 1 km 100 m SAR/PM Snow pack Pre-flood 1 km 100 m SAR/PM DEM (vertical) Pre-flood 1-3 m .10-.15 m InSAR/ Post-flood PanVis Flood development During flood <= 30 m <= 5 m SAR/MSI/and flood peak Post flood PanVis Damage Post-flood 2-5 m .3 m MSI/PanVis/Assessment SAR Bathymetry Pre-flood < 1 km 90 m SAR/MSI/HIS(near shore) MSI = Multi-Spectral Imagery PanVis = Panchromatic Visible InSAR = Interferometric SAR HIS = Hyper-Spectral Imagery SAR = Synthetic Aperture Radar PM = Passive Microwave
months Infrastructure status 1-3 yrs / 6 months months Land use 1-3 yrs / 6 months months Vegetation 3 months / 1 month 1 day Soil Moisture 1 week/daily 1 day Snow Pack 2 month/1 week DEM pre- & post-flood 1-3 yrs / months months hours-days (function of Flood development hours-days (function drain age basin) / 24 hr Flood peak of drainage basin) 2-3 days / < 1 day Damage assessment n/a months Bathymetry pre- and 1-3 yrs / months post-flood Temporal Resolution Requirements By Application Image refresh rate Image delivery time (Threshold/Optimum) Application (Threshold/Optimum)
T E A M R E Q U I R E M E N T S Oil Spill
Enforcement / 100m 100km weekly N/A 3 hours monitoring 50m 300km daily < 1 hour Major coastal spill 20m 30km daily 2 days 2 hours (accident) 5m >100km hourly < 1 day < 1 hour Minor coastal spill 100m 100km daily N/A 3 hours (dumping) 50m 300km hourly < 1 hour Spill distribution 100m 100km weekly N/A N/A survey 50m 300km daily Observational Requirements For C-Band SAR Threshold Optimum Spatial Delivery Use Case Spatial Temporal Tasking resolution time time coverage resolution Spatial coverage = swath width Note: To match costs of airborne SLAR, costs must be < 2.5 ¢ / km2
T E A M R E Q U I R E M E N T S Volcanic Hazards
Data Resolution Requirements Spatial Temporal Phenomenon Data Threshold Optimum Threshold Optimum Ash cloud IR 5 km 1 km 30 min 15 min Visible 1 km .5 km 30 min 15 min Sounder 10 km 2 km 30 min 15 min SO2 Cloud UV 20 km 10 km 2 hr 15 min Thermal Anomaly * IR 1 km 30 m - Persistent 2 hr 15 min - Transient 30 sec 10 sec * Thermal anomaly verified with false alarm ratio <5%