Download
1 / 13
130 likes | 290 Views
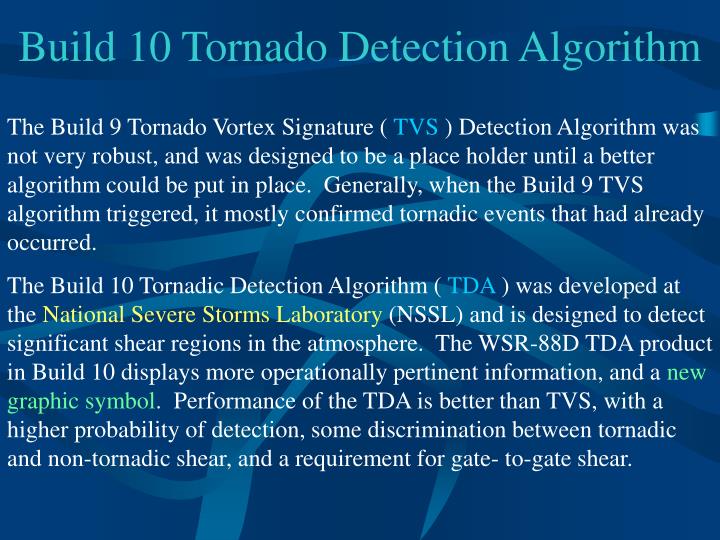
Build 10 Tornado Detection Algorithm.

E N D
Build 10 Tornado Detection Algorithm The Build 9 Tornado Vortex Signature ( TVS ) Detection Algorithm was not very robust, and was designed to be a place holder until a better algorithm could be put in place. Generally, when the Build 9 TVS algorithm triggered, it mostly confirmed tornadic events that had already occurred. The Build 10 Tornadic Detection Algorithm ( TDA ) was developed at the National Severe Storms Laboratory (NSSL) and is designed to detect significant shear regions in the atmosphere. The WSR-88D TDA product in Build 10 displays more operationally pertinent information, and a new graphic symbol. Performance of the TDA is better than TVS, with a higher probability of detection, some discrimination between tornadic and non-tornadic shear, and a requirement for gate- to-gate shear.
Build 9 - A Brief Review The Build 9 TVS and mesocyclone algorithms worked together, and in fact, the bulk of the velocity analysis for TVS was actually performed by the mesocyclone algorithm. If a meso was found, then and only then, would the TVS algorithm perform a shear calculation within the circulation to determine if a TVS also existed. In Build 9, a TVS cannot exist without an algorithm-identified mesocyclone. Mesocyclone identification is a multi-step process. It first identifies patterns of velocity data that satisfy momentum and shear criteria. These patterns are combined into 2-D features (patterns on a flat plane at one elevation slice). The 2-D features are then correlated to patterns on adjacent elevation slices to form 3-D circulations. A circulation is labeled as a Mesocyclone when the 3-D circulation meets an aspect ratio of a given length to width. Because the TVS was inextricably linked to the Meso algorithm, it was possible that a smaller TVS rotation would not be identified because the circulation did not meet mesocyclone criteria.
Build 10 and the TDA In Build 10, the Mesocyclone and Tornado Detection algorithms process separately. Here is a step by step process of how the TDA works: First, 1-D pattern vectors are identified on each elevation slice. In TDA, a pattern vector is a region of gate-to-gate shear, which means the velocity difference is calculated between range bins located on adjacent azimuths at the same range. A minimum shear value is required for a pattern vector to be identified. The TDA searches only for patterns of velocity indicating cyclonic rotation. It does not detect an anticyclonically rotating tornadic signature. TDA pattern vectors are shown in Pink. For reference, mesocyclone pattern vectors are shown in blue.
Build 10 and the TDA Next, 2-D features are created by combining the 1-D pattern vectors. At least three pattern vectors are needed to declare a 2-D feature. TDA uses six velocity difference thresholds to identify pattern vectors. TDA pattern vectors are shown in pink. For reference, mesocyclone pattern vectors are shown in blue and the old TVS shear calculation would have used the red and green values. You can already see the higher resolution capability of the TDA compared to the TVS algorithm. The old TVS red and green values don’t fall within the new TDA pattern criteria. Note the significant difference in the shear calculation between the old TVS and new TDA algorithms. Shear = V/d
Build 10 and the TDA Finally, 3-D features are created by vertically correlating the 2-D circulations identified at each elevation. Processing begins by correlating the strongest 2-D circulations first, then moving to progressively weaker circulations. If a feature contains at least three vertically correlated 2-D circulations, it is declared a 3-D circulation, and identified as either a TVS or an ETVS. Vertically correlated 2-D circulations
Definitions and Symbols TVS - Tornado Vortex Signature It is defined as a 3-D circulation with a base located on the 0.50 elevation or below 600 meters ARL (above radar level). The depth of the circulation must be at least 1.5 km. Additionally, the maximum DELTA velocity anywhere in the circulation must be at least 36 m/s, or at least 25 m/s at the base of the circulation. The TVS symbol is displayed on the graphic product and overlay as a red filled inverted triangle, slightly larger than the Build 9 symbol. TVS symbols are placed at the azimuth and range of the lowest 2-D feature.
Definitions and Symbols ETVS - Elevated Tornado Vortex Signature It is defined as a 3-D circulation with a base above the 0.50 elevation and above 600 meters ARL. The depth of the circulation must be at least 1.5 km. Additionally, the DELTA velocity at the base of the circulation must be at least 25 m/s. The ETVS symbol is displayed on the graphic product and overlay as a red, open, inverted triangle, and is placed at the azimuth and range of the lowest 2-D feature.
TDA Attribute Table Definitions LLDV: Low-Level Delta Velocity, in knots (greatest velocity difference of lowest 2-D circulation MDV: Maximum Delta Velocity, in knots (greatest velocity difference of any 2-D circulation AVGDV: Average Delta Velocity, in knots (average weighted velocity difference of all 2-D circulations. BASE: Lowest altitude of the 3-D circulation, in Kft (altitude of the lowest 2- D circulation) DPTH: Depth of the 3-D circulation, in Kft (height difference between the lowest and highest 2-D circulation) If a circulation exists at either 0.50 or 19.50, then the depth of the circulation (DPTH) is estimated, and a > (greater than) symbol will be displayed with the stated depth. Similarly, if the circulation exists at 0.50, the base (BASE) of the circulation is estimated, and a < (less than) symbol will be used with the stated base altitude.
TDA Strengths * Velocity processing is more sophisticated with TDA. Shears must be gate-to-gate, which is more closely related to tornadic circulations as compared to strong shear that is not gate-to-gate. * The algorithm searches all velocity pairs, not just those within a mesocyclone * More operationally pertinent information is provided to the radar operator about shear type (TVS vs. ETVS) and base/depth of circulations. * There are more adaptable parameters, allowing fine tuning of the algorithm performance, resulting in a higher probability of detecting important shear regions.
TDA Limitations * Adaptable parameters need more research. What works well in one meteorological setting may not be effective in another. * There is a higher False Alarm Ratio (FAR) with TDA, which will require a change in operational philosophy. Operators are accustomed to a very low FAR with build 9 TVS signatures, implying a more serious reaction (warning) when a TVS was triggered. A higher FAR with TDA may result in over-warning, or desensitizing forecasters. * Little research has been done relating the occurrence of tornadoes to Elevated TVSs (ETVS). Forecasters should use ETVS with caution until they develop a better understanding of its utility.
TDA Operational Considerations When a TVS is triggered by the new TDA, consider: - The environmental wind - The thermal profile - TVSs position in relation to the storm - Time continuity of the TVS - Storm’s range from the radar Since the TDA works independently of the mesocyclone algorithm, the detection of a meso coincident with the TVS may support issuing a tornado warning. If the TVS is adjacent to a strong reflectivity gradient near the back of a storm, near a notch on the right rear flank of a storm, or near the tip of an appendage attached to the right rear flank of a storm, then the forecaster should give greater consideration to issuing a tornado warning. Because of its sensitivity, the TDA shows more continuity in time and space. TVS detections for the same storm on two or more consecutive volumes can suggest the validity of a tornado warning. ETVSs are routinely generated by the TDA, but do not score statistically as well as TVSs. However, ETVSs can be used as indicators of rotation aloft that could eventually produce a tornado (lead time). One should be cautious about issuing a tornado warning based solely on ETVSs.
New Combined Attribute Table This is an example of the table that accompanies the Composite Reflectivity graphic Cells containing these attributes will be listed in the following order: TVS , MESO, 3D Correlated Shear, Uncorrelated Shear, POSH, POH, Cell-based VIL Legend: STM ID & AZ/RAN - ID and location (from radar) of storm centroid TVS - TVS (tornado vortex signature identified in lowest elevation slice) - ETVS (elevated tornado vortex signature identified. Not identified in lowest slice) - NONE (No TVS or ETVS identified) MESO - MESO (Mesocyclone identified) - 3DCO (3-D Correlated Shear identified. Did not meet necessary aspect ratio of length to width for “mesocyclone” identification) - UNCO (Uncorrelated Shear identified. Only a 2-D pattern detected with no correlation in the vertical) POSH - Probability of Severe Hail identified as hail that is 3/4", displayed in increments of 10%. Graphic symbol is a large geen triangle (displayed solid if percentage is 50%)
This is an example of the table that accompanies the Composite Reflectivity graphic New Combined Attribute Table Cells containing these attributes will be listed in the following order: TVS , MESO, 3D Correlated Shear, Uncorrelated Shear, POSH, POH, Cell-based VIL Legend: POH - Probability of Hail - identified as hail of any size, displayed in increments of 10%. Graphic symbol a small geen triangle (displayed solid if percentage is 50%) MX SIZE - Maximum Estimated Hail Size. Plotted in the center of the POSH triangle to the nearest inch. VIL - Vertically Integrated Liquid. Used as a measure of storm intensity and as a hail predictor. Determine “VIL of the Day” to predict thunderstorm’s potential for severe hail. DBZM HT - Max Dbz detected and it’s height TOP - Cell top height FCST MVMT - Direction/speed (kts) from which storm is moving