Download
1 / 37
370 likes | 557 Views
Describing blood cell differentiation with stochastic methods: biological insights. Jan Abkowitz Univ. of Washington, Seattle, WA BIRS. July, 2017. Blood system. platelet. white cell (lymphocyte). red cell. white cell (granulocyte). Hematopoiesis = blood cell production.

E N D
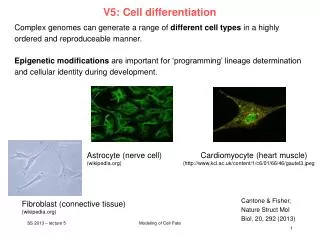
Describing blood cell differentiation with stochastic methods: biological insights. Jan Abkowitz Univ. of Washington, Seattle, WA BIRS. July, 2017
Blood system platelet white cell (lymphocyte) red cell white cell (granulocyte)
Hematopoiesis = blood cell production bone marrow blood
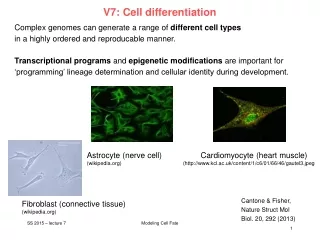
Cellular and molecular biology of hematopoietic stem cells (HSC). HSC’s marrow environment HSC’s intracellular signaling
Difficulties in studying HSCs • HSCs cannot be directly observed. • Inaccuracy in counting. Flow cytometric markers define phenotype, not function. Cells that die or do not differentiate during an observation time are not counted with traditional analyses of competitive transplantation studies. If lentiviral marker is used as the readout, a HSC that replicates (self-renews) to generate two HSCs will be counted as “one clone” and not appreciated as two independent cells. • Heterogeneity. Each HSC and its decisions are unique.
The geography of hematopoiesis adds further complexities. • HSC are mobile. • Numbers are reasonably constant and stable with aging.
Principles from other systems Traffic Ecology Persons live in homes, make independent and unique decisions, and mobilize. Systems analyses can provide insights to traffic patterns and strategies for traffic improvements. Species compete for the limited resources. The most complex ecosystems are the most stable (e.g., Neutel et al, Nature 449:599,2007).
Hematopoiesis as a system • There is a number of HSCs (N) and a steady state number of HSCs (K). • HSCs can replicate, differentiate or die. Mean rates are termed , , and , respectively. • Once a HSC differentiates there is a mean time over which its progeny contribute to blood cell production (the rate of exhaustion is termed m). • Thus we can describe hematopoiesis with 5 facts: N is < K and , , , and m exist.
Hematopoiesis as a system 2 assumptions. • HSCs do not act based on history (do not remember prior decisions), but rather act depending on immediate input, such as interactions with the environment (the Markovian assumption). • All contributing clones contribute equally.
Questions • How many stem cells are there? What is K? • How do they support hematopoiesis? What are , , , and m ? • How is homeostasis maintained? What determines and preserves K? • My question: do all HSC continually contribute to blood cell production or is there clonal succession?
Female Safari cat (F1 offspring ofGeoffroy x domestic cat) % progenitors with d G6PD XG Xd XG Xd weeks XG Xd XG XG Xd Xd Cat studies Early embryo Lyonization (X chromosome inactivation) Cells and their progeny contain G or d G6PD
Limiting dilution competitive transplantation studies • Harvest marrow. • Irradiate the cat (920 cgy) to ablate its remaining HSC. • Return the marrow and thus require the small numbers of HSC that were present in this aliquot to reconstitute hematopoiesis. • Within 4 weeks the CBC recovered and was normal throughout the observations. • Determined the G6PD phenotype of progenitors over the subsequent six years.
Virtual transplantation studies • Assign an arbitrary value for N, , , and m. • Transplant marrow containing N stem cells into irradiated virtual cat. Stem cells reconstitute hematopoiesis and behave stochastically (mean rates , , ). Clones contribute for a mean of m weeks. • Track the G6PD type of progenitors for 6 years. • Repeat experiment 100 times. • Ask if the outcomes in the 6 female Safari cats could be a random draw from the outcomes of the 100 virtual transplantation studies. • Explore 5 dimensional space to define all plausible parameter values.
% dG6PD % dG6PD % dG6PD % dG6PD Simulated transplantations with 10 HSCs weeks weeks weeks weeks
weeks weeks weeks Simulated transplantations with 100 HSCs % dG6PD % dG6PD % dG6PD % dG6PD weeks
weeks weeks weeks weeks Simulated transplantations with 30 HSCs % dG6PD 40628 % dG6PD 40005 40004 % dG6PD 40005 40665 % dG6PD
Cat HSC parameter values N (number of transplanted HSCs) 30 (HSC replication rate) 1 per 8.3–10 wks (HSC differentiation rate) 1 per 12.5 wks (HSC apoptosis rate) 0–1 per 50 wks m (time clones contribute to hematopoiesis) 6.7 wks If 30 HSCs were present among the 5 x 10⁷ nucleated marrow cells (NMC) that were transplanted, the frequency of feline HSCs is 6/107 NMC. Nature Medicine 2:190,1996
Mouse HSC parameter values Frequency of HSCs* 4–8 / 105 NMC (HSC replication rate)* 1 per 2.5 wks (HSC differentiation rate) 1 per 3.4 wks (HSC apoptosis rate) 1 per 20 wks m (time clones contribute to hematopoiesis)* 6.9 wks *Validated by other methods: phenotype determinations, BrdU labeling studies, single cell transplantation. Blood 96:3399, 2000.
How many stem cells are there in an animal? • Total number of HSCs = HSCs/nucleated marrow cells x total number of NMC • Total of number of NMC has been computed for mice by observing the distribution of 59Fe-transferrin in marrow. We computed the total number of NMC in cats with these methods.
4-8 HSC/105 NMC 2.8 108 NMC/mouse= 11,200 - 22,400 HSCs/mouse mouse 6 HSC/107 NMC 1.9 1010 NMC/cat = 11,400 HSCs/cat cat Number of HSCs per mammal Blood 100:2665, 2002.
Messages One can gain unique insights from: • Describing hematopoiesis as a stochastic process. • Analyzing the hematopoietic system from an evolutionary perspective. What principles are conserved between mouse, cat, baboon and man?
HSCs in non-human primates • Competitive transplantation studies are not feasible. • Use surrogate assays. 1. Telomere shortening with aging in granulocytes(data from Hans Peter Kiem, Seattle, WA and Peter Lansdorp, Vancouver, CA). Validate the analysis and simulation approach in cat, then apply these methods to the primate data, adding the information that the total number of HSCs is evolutionarily conserved. 2. Pattern of clonal contribution after retroviral gene transfer (data from Hans Peter Kiem, Seattle, WA and Cindy Dunbar, NIH). • Estimates (HSC replication rate) as once per 23 – 36 weeks. Blood 110:1806, 2007.
Further insights from the baboon studies The number of HSC replications per animal lifetime is conserved and is ~ 80 - 200. Blood 110:1806, 2007.
What about human HSCs? • Use surrogate assays. Telomere shortening with aging in granulocytes (Peter Lansdorp, Vancouver, Canada). Skewing of X-chromosome inactivation pattern in blood cells from women (Lambert Busque, Montreal, Canada; Rosemary Gale, London UK). • Validate the analysis methods in cat, then apply this to man. l for human HSCs= once per 45 weeks (range 23-67 weeks)(telomere data) l for human HSCs= once per 40 weeks (range 25-50 weeks)(XCI data) Blood 117:4460, 2011.
Does this make sense?Simulations of human hematopoiesis Virtual marrow transplantations (70 kg donor, 70 kg recipient) • Transplantation of 2 x 10⁸ marrow cells/kg = 100 HSC. All virtual recipients engraft and maintain polyclonal hematopoiesis. • Transplantation of 1 x 10⁸ marrow cells/kg = 50 HSC. Graft failure occurs in 15% of the simulations. • Interestingly, this is not b/o a lack of HSC, but a lack of differentiating clones.
Implications • After transplantation, patients are especially sensitive to chemotherapy because they have relatively few STRCs, not a paucity of HSCs. • Children (small size, fewer mature blood cells) tolerate transplantations of fewer HSCs better than adults because the few active clones can produce safe numbers of granulocytes, lymphocytes, red cells and platelets. • Supplementing HSC transplantation with infusions of STRCs (such as present in Notch ligand delta1-expanded cord blood) should be an efficacious method to insure adequate hematopoiesis. • These data also raise the possibility that human marrow failure syndromes, such as aplastic anemia or myelodysplasia, could result from defective HSC commitment or defective expansion of differentiating clones, and not only from the destruction or depletion of HSCs.
Other projects • Is a HSC’s fate decision determined at the time of replication? When a HSC replicates, is it required that one offspring differentiate and one remain an HSC? (Youyi Fong) • Is HSC commitment to lineages a series of stochastic events or a preprogrammed path? (Jason Xu)
Development of a simulation tool to visualize the hematopoietic system A. B.
Graduate students • Michael Newton. University of Wisconsin. • Sandra Catlin. University of Nevada. • Daniela Golinelli. Mathimatica Policy Research. • Bryan Shepherd. Vanderbilt University. • Youyi Fong. Fred Hutchinson Cancer Research Center. • Jason Xu (with Vladimir Minin). NSF postdoctoral fellowship. UCLA.
Abkowitz lab Sioban Keel Zhantao Yang Mary Philip Jing Chen Kathleen Sabo Raymond Doty Wei Qiao
Blood RBC Life RBC RBC volume lifespan RBC expectancy per life Species per ml Weight ml days per day years of animal Mouse9.0x 109 25 g 1.8 50 3.2 x 10⁸ 2 2.4 x 10¹¹ Man 6.0 x 10⁹ 70 kg 4900 120 2.5 x 10¹¹ 80 7.3 x 10¹⁵ Cat 7.5 x 10⁹ 4 kg 280 70 3.0 x 10¹⁰ 15 1.6 x 10¹⁴ Hematopoietic demand in different species If the total number of HSC is reasonably constant, then the proliferative demand on a differentiating stem cell clone in cat or man must be significantly greater than in mouse.
Systems analyses • Define components. Parts list. • Define interactions. • Determine how and why interactions occur and their consequences. • A complex system is a network of interactions that involves components in more than one temporal or spacial scale. • This approach provides insights into the dynamics of a system, such as its robustness, stability, evolution or responsiveness that allow predictions of subsequent behaviors. • This method is most powerful when one predicts a systems response to perturbation and then tests the accuracy of the prediction experimentally.