Download
1 / 83
830 likes | 905 Views
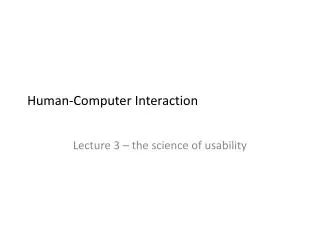
Usability with Project Lecture 10 – 19/03/10. Dr. Simeon Keates. Exercise – part 1. Consider sending an SMS or e-mail Look at one of your mobile phones … And a laptop, etc. Perform exclusion calculations on each product using the data on: http://www.eng.cam.ac.uk/inclusivedesign/.

E N D
Usability with ProjectLecture 10 – 19/03/10 Dr. Simeon Keates
Exercise – part 1 • Consider sending an SMS or e-mail • Look at one of your mobile phones … • And a laptop, etc. • Perform exclusion calculations on each product using the data on: • http://www.eng.cam.ac.uk/inclusivedesign/
Exercise – part 2 • Identify the common methods of interacting with the product • Identify which of the 7 DFS capability scales are involved in the interaction • Based on the DFS scales, estimate the limiting capability demand for each scale
Exercise – part 3 • Report the number and %age of people excluded by each capability demand • For 16+ and 75+ • Report the total number and %age of people excluded by the product • For 16+ and 75+ • Prepare a 5 minute presentation to discuss: • Your exclusion calculation assumptions • Your exclusion calculation results • What were the principal causes of exclusion? • What do you think should be done to reduce the exclusion for each product?
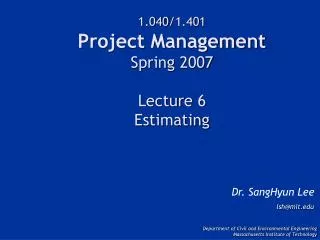
Service provider Remote control User Remote control Set top box (STB) A systems overview Television
Motivations for study • Commissioned by UK Department of Trade and Industry • Wanted to find out who could not access DTT • Original focus on ‘the disabled’ • Definition broadened... Why?
Typical assessment methods used in this research • Expert assessment • Exclusion analysis • User observation • Questionnaires • Interviews • Focus Groups Assessment of STBs Customer expectations
Methodology - Choice of STBs 2 STBs chosen for study • STB1 - marketed as “easy to use” • STB2 - market leader 1 digital satellite system chose as comparison • STB3– developed by content provider
Expert assessment • 4 assessors • 2 with DTV experience, 2 without • STB protocol only • Aims to identify most likely sources of problems • Define protocol for following assessments
Methodology - Analogue TV protocol • 6 activities • Switch on • Change channel • Change volume • Teletext (find local weather) • Subtitles (on/off) • Switch off
Methodology - STB protocol • 8 activities • Installation • Switch on • Change channels (direct + EPG) • Change volume • Teletext (find local weather) • Subtitles (on/off) • BBCi (find local weather) • Switch off
Expert Assessment - Results 13 major sources of difficulty found • 4 – Installation and set-up • e.g. instruction manual, initial tuning • 5 – Operation • e.g. multiple modes, subtitles • 4 – Remote controls • e.g. labelling, layout
Exclusion analysis • Systematic analysis • Combined with data from Office of National Statistics • Population data 1996/7 UK Disability Follow-Up Survey • Aims to calculate how many people have the difficulties highlighted by expert assessment • How many people in the user observation should have those difficulties?
Exclusion analysis - Results 16+ 75+ 25 20 Population (,000s) 15 10 5 0 Analogue DTV Analogue DTV
Exclusion analysis - Results 16+ 75+ 25 25 20 20 Population (,000s) Population (%age) 15 15 10 10 5 5 0 0 Analogue DTV Analogue DTV
User observations - Overview • 13 users - 12 aged 60+, 1 aged 24 • 9 no DTV experience • 2 owned STBs • 1 owned satellite box • 1 owned iDTV • 7 PC users, 6 non-users • All ‘independent’ living
User observations - Methodology 2 hour sessions comprising: • 30 minutes briefing • 60-75 minutes with equipment • 15-20 minutes analogue • 40-60 minutes DTV • 2 STBs • 15 minutes debriefing
User observations - Example visual problems • Finding buttons on r/c • Especially POWER • Switching between r/c and screen • Different pairs of glasses • Reading on-screen font • No zoom facility • Reading instruction manual • Small print New difficulty
User observations - Example motor problems • Pressing buttons on r/c • Size and shape • Time-outs • e.g. on EPG (040 -> 004) • Arrow button overshoot • Oscillating cursor New difficulty New difficulty
User observations - Example ‘cognitive’ problems • Use of OK/SELECT • Inconsistent language (OK=SELECT?) • Which r/c to use / which mode am I in? • How to start/navigate BBCi/Teletext? • How to call up/navigate on-screen menus? • How to operate/navigate the EPG? • Inconsistent layout • e.g. LHS on screen, RHS on r/c
Summary • Cognitive/experience issues most important • Many of the problems easily avoidable
Classic case of “designers designing for themselves” Origins of the problems for older users • New language / terminology • Jargon • New input paradigms • Part TV, part PC • New interaction concept • Interacting with STB, not TV • Inadequate explanation
Implications of prevalence of cognitive difficulties • What does this mean for assessment methods? • Single assessment methods vs. multiple? • In what order should they be used? • What does this mean for designers? • How to design for different experience?
Defining “reasonable accommodation” • Must offer “reasonable accommodation” • BUT what is reasonable? • Not defined explicitly • Companies left guessing • Will be defined in courts • Major risk/headache for companies
IDEOLOGICAL DIVIDE Attitudes to “reasonable accommodation” EQUITABLE ACCESS EQUITABLE ACCESS MINIMUM (compliance) Access to functionality MINIMUM (compliance) Access to functionality IDEAL Access to functionality in same time IDEAL Access to functionality in same time Pragmatists Idealists
Interesting questions for companies • Is the equitable access ideal possible? • Is the equitable access minimum possible? • “ Equal, but different ” problem • Users with functional impairments => longer times • Can technology always make up the difference in user capabilities? 3 case studies…
The information point accessibility assessment Sensory assessment: • Screen too high and not adjustable • Audio output not duplicated • Visual output not duplicated Motor assessment: • Need to stand • Reaching and dexterity demands • 53%of target users excluded Is this “reasonable”?
Case study 2 – Cursor assistance for motor-impaired users Symptoms that can affect cursor control: • Tremor • Spasm • Restricted motion • Reduced strength • Poor co-ordination
User group behaviours Peak velocities Target activation times No. of incorrect clicks
Summarising the differences • Younger adults (IBM interns) • Shortest (1), fastest (1), more errors (3) - slapdash • “I can fix it” • Games culture? • Adults (IBM regulars) • Shorter (2), faster (2), fewest errors (1) • Best compromise between speed and accuracy? • Parkinson’s users • Longer (3), slowest (4), fewer errors (2) • Slow, but sure • Older adults • Longest (4), slower (3), most errors (4) • Vision difficulties? • Lack of experience
A method of cursor assistance • Haptic gravity wells: Gravity well Attractive force Target
The effect of gravity wells Target
Case study 2 summary • Haptic gravity wells are clearly very helpful • MI users “with” on similar level to AB users “without” BUT: • AB users also improve “with” • Is this “equal” time? • Is this “reasonable”???
Case study 3 – Paperless office • AN Other wants to move to a paperless office • Currently receives 3.5 million pages per day • Paper documents are stored as TIFFs • Section 508 accessibility requirements • Sight-impaired • Low vision • Current solution – employ readers • “ Equal, but different. ” • Is this reasonable?
The study documents • Almost fully unconstrained • Content: • Unconstrained vocabulary • Text: • Typed • Handwritten • Annotated • Stamps • Graphical content: • Diagrams • Charts • Graphs
Readability metrics (text) • Translation rates: • Character-by-character • Word-by-word • Number and %ages of errors: • Level 1 - Minor • Level 2 - Moderate • Level 3 - Serious