Download
1 / 21
210 likes | 319 Views
IMPACTS OF MODELING CHOICES ON RELATIVE RESPONSE FACTORS IN ATLANTA, GA. Byeong-Uk Kim, Maudood Khan , Amit Marmur , and James Boylan 6 th Annual CMAS Conference Chapel Hill, NC October 2 , 2007. Objective.

E N D
IMPACTS OF MODELING CHOICES ON RELATIVE RESPONSE FACTORS IN ATLANTA, GA Byeong-Uk Kim, Maudood Khan, Amit Marmur, and James Boylan6th Annual CMAS ConferenceChapel Hill, NCOctober 2, 2007
Objective • Investigate the effects of modeling choices on Relative Response Factors (RRFs) in Atlanta, GA • Horizontal grid resolution: 4 km and 12 km • Chemical Transport Model: CMAQ and CAMx
Approach • Exercising typical SIP modeling • Model Performance Evaluation (MPE) • Measures and methods following the EPA’s guidance document (EPA, 2007) • Modeled Attainment Test • Relative Response Factors • Additional analyses • MPE with graphical measures • Partial implementation of PROMPT (Kim and Jeffries, 2006) • Investigation of day-by-day and site-by-site variation of model predictions
Modeled Attainment Test • Future Attainment Status is determined by Future Design Value (DVf) • DVf should be less than 0.85 ppm. • DVf = RRF x DVb Where, DVb is Baseline Design Value and RRF is Relative Response Factor defined as
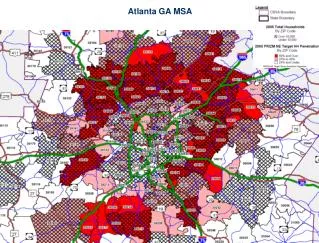
Modeling System Setup • Base case modeling period • May 21, 2002 ~ Sep 13, 2002 UTC (3 spin-up days ) • MM5 (v 3.x) • Pleim-Xiu model for Land-Surface interaction • Asymmetric Convective Mixing • SMOKE (v 2.x) • VISTAS Base G version 2 inventory • CMAQ and CAMx • Inputs made to be close to each model for a same grid configuration. Georgia
4 km 7x7 array for 4-km runs 12 km
Time series O3 Mon Tue Wed Thur Fri Sat Sun O3
Time series NO2 Mon Tue Wed Thur Fri Sat Sun ETH
Time series O3 Mon Tue Wed Thur Fri Sat Sun O3
NO2 Mon Tue Wed Thur Fri Sat Sun ETH
Spatial distribution (12km)Daily Max 8-hr O3 2002-06-12 2002-07-23 2002-07-24 CAMx ppb CAMx-CMAQ ppb
Relative Response Factors RRFs from max O3 nearby grid cell arrays • Two possible methods to calculate RRFs • Max value in “nearby” grid cell arrays • Value at each monitoring site grid cell • Spatially averaged RRFs vary from 0.891 to 0.897 by modeling choices • If DVb = 100 ppb, 0.001 difference in RRF will result in 0.1 ppb in DVf.
Conclusion (1) • Reasonable performance with respect to statistical metrics by all four models, CMAQ and CAMx with 4-km and 12-km grids • 4-km emissions had 11% lower NOx in non-attainment areas • 4-km MM5 runs showed poor nighttime performance. • Higher biases during nighttime by CMAQ and during daytime by CAMx • Gross overestimation of ozone by CAMx for several days • Lower biases from 4-km simulations • Probably due to emission discrepancies in 4-km inputs compared with 12-km emissions. • No significant daytime NOx biases
Conclusion (2) • Stable or insensitive RRFs • Due to higher absolute concentrations predicted by CAMx, CAMx might show quite lower RRFs than CMAQ. • Max-Value based RRFs fell within 0.863 ~ 0.914 for all simulations. • Effect of RRF calculation methods • Despite of noticeable differences between 4-km and 12-km modeling inputs, Max-Value based RRFs does not reflect this fact significantly. • Cell-Value based RRF distinguished grid configuration differences. • For all 11 monitoring sites, maximum RRF difference due to model choices were 0.036 and 0.033 by Max-Value based and Cell-Value based RRF calculation.
Future Work • Process Analysis to explain large variation of predicted ozone concentrations with similar modeling inputs • Detail study on the relationship between model performance including day-by-day and site-by-site meteorological model performance and RRFs
Acknowledgement • ENVIRON International Corporation • Ralph Morris for CMAQ-to-CAMx utilities
Contact Information Byeong-Uk Kim, Ph.D.Georgia Environmental Protection Division4244 International Parkway, Suite 120Atlanta, GA 30354Byeong_Kim@dnr.state.ga.us 404-362-2526