Download

1 / 35
350 likes | 470 Views
Observational Data Analysis to Support PM 2.5 SIP Development. Jay Turner and Jen Garlock Department of Energy, Environment and Chemical Engineering Washington University. Modeling and Control Strategies Joint Workgroup Meeting Saint Louis, MO June 4, 2007.

E N D
Observational Data Analysis to Support PM2.5 SIP Development Jay Turner and Jen Garlock Department of Energy, Environment and Chemical Engineering Washington University Modeling and Control Strategies Joint Workgroup Meeting Saint Louis, MO June 4, 2007 St. Louis 8-Hour Ozone and PM2.5 State Implementation Plan (SIP) Workgroup
Today’s Update • Refinements to interpretation of the PM2.5 mass apportionment for East St. Louis • PM2.5 organic carbon apportionment for East St. Louis • Urban/rural contrast for OC (Blair vs. Bonne Terre) • Analysis for the current design value site (Granite City) • Speciated Modeled Attainment Test framework
Refined East St. Louis PM2.5 Mass Apportionment all concentration values in mg/m3
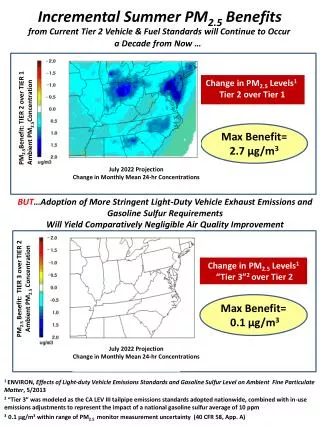
Caveats to Biomass BurningContributions (PM2.5 Mass Apportionment) • Daily source contributions do not correlate with measured levoglucosan (a tracer for wood smoke) • Daily source contributions do not correlate with FIP (Fire Impact Potential) values calculated by Sonoma Tech • Source contributions rarely drop below 1 µg/m3 • In UWM’s OC apportionment, PMF assigned ~0.9 µg/m3 OM to biomass, and CMB assigned ~1.2 µg/m3 OM to biomass (compared to 1.8 µg/m3 total PM2.5 mass) • However: analysis by the Advanced Modeling Initiative (AMI) group at USEPA does indicate this factor is strongly influenced by air masses from the south. This geographic area has significant fire activity, primarily in the fall...
Satellite Detected Fires by Season (Sonoma Technology, Inc.) May 2001 – May 2005
Selected Apportionment Refinements & Insights • Secondary Nitrate • Recent analysis shows highest nitrate influence from the northeast (Great Lakes region) • Previously thought to be from the intense agricultural areas to the northwest (Upper Midwest region) • Admixing of Regional PM into Point Source Factors • Comparison of single-site and multiple-site apportionments to examine robustness of the factor profiles • Soil II / Resuspended Road Dust • At three different sites (Arnold, Blair, East St. Louis) this source shows influence from the Mississippi River (regardless of the site being east or west of the river) • Perhaps includes off-road diesel traffic (barge and train), on-road diesel traffic, and fugitive emissions from coal piles and possibly other transported materials
PMF-Resolved Regional Nitrate Factor: Potential Source Regions • USEPA Air Pollution Transport to Receptor module (not yet released) • Quantitative Transport Bias Analysis (QTBA) module • Analysis performed by Dr. Gary Norris, USEPA/ORD
Selected Apportionment Refinements & Insights • Secondary Nitrate • Recent analysis shows highest nitrate influence from the northeast (Great Lakes region) • Previously thought to be from the intense agricultural areas to the northwest (Upper Midwest region) • Admixing of Regional PM into Point Source Factors • Comparison of single-site and multiple-site apportionments to examine robustness of the factor profiles • Soil II / Resuspended Road Dust • At three different sites (Arnold, Blair, East St. Louis) this source shows influence from the Mississippi River (regardless of the site being east or west of the river) • Perhaps includes off-road diesel traffic (barge and train), on-road diesel traffic, and fugitive emissions from coal piles and possibly other transported materials
Source Apportionment on Data from a Single Site Receptor 1 Source 2 + Any other sources with the same bearing as Source 1 from a given receptor may be admixed into the Source 1 profile. Source 1 Receptor 2
Source Apportionment on Data from Multiple Sites • Sources may also covary with regional species that have prevailing wind directions from the same bearing • Receptor 2 would likely exhibit covariance between Source 1 and nitrate. • Receptor 1 would likely exhibit covariance between Source 1 and sulfate. • By combining data from multiple sites we aim to reduce covariance between multiple sources (or sources and regional species) that leads to admixing in the resolved factors Secondary Nitrate Receptor 1 Source 1 Receptor 2 Secondary Sulfate
Example - Factor Assigned to Copper Processing (point source in Sauget) Admixing of several sources and addition of regional species to local profiles are our biggest concerns SO4 and NO3 – largely regional species, absent for the combined analysis EC – perhaps an EC source along the path between Sauget and Arnold Arnold - Individual Analysis Arnold - Combined Analysis
Selected Apportionment Refinements & Insights • Secondary Nitrate • Recent analysis shows highest nitrate influence from the northeast (Great Lakes region) • Previously thought to be from the intense agricultural areas to the northwest (Upper Midwest region) • Admixing of Regional PM into Point Source Factors • Comparison of single-site and multiple-site apportionments to examine robustness of the factor profiles • Soil II / Resuspended Road Dust • At three different sites (Arnold, Blair, East St. Louis) this source shows influence from the Mississippi River (regardless of the site being east or west of the river) • Perhaps includes off-road diesel traffic (barge and train), on-road diesel traffic, and fugitive emissions from coal piles and possibly other transported materials
Conditional Probability Function (CPF) • Uses hourly wind direction data along with daily averaged source contributions to identify the bearing of likely sources contributing to a given factor. • The radius of each barb represents the fraction of hours for that wind sector which correspond to a day with one of the top quartile contributions. • CPF plots indicate that the “diesel” factor is likely more complex than just on-road (especially highway) diesel vehicle emissions...
“Diesel” (or Calcium-Rich) Factor • 3-site combined analysis • At all sites, the highest frequency of high source contributions corresponds to winds from the Mississippi River • In all three cases, the CPF plots point towards coal piles along the riverfront!
Calcium-Rich Factor at East St. Louis Interstate on-ramp? coal pile / barge unloading rail car repair shop ? (exceptional event) • Current interpretation of this factor – possibly on-road and off-road diesels (including trains, barges?) with resuspended coal dust
Mass Apportionment Summary • As-modeled apportionments typically an upper bound due to admixing of multiple point sources and regional contributions • Refinements to the PM2.5 mass apportionment are providing bounds for the contributions from sources • CPF plots and other allied data are providing insights into emissions activities and locations • Emissions activities related to materials transport on the Mississippi River emerge from this analysis
Organic Carbon Source Apportionment Source apportionment of speciated organics data by the Schauer group, University of Wisconsin – Madison • 1-in-6 day data over a two –year period • Chemical Mass Balance: limited utility since source profiles are not available, or necessarily representative, for all significant sources • Positive Matrix Factorization also performed • Resolved eight factors, assigned to source categories where possible based on the organic species loading onto the factors…
Organic Carbon Source Apportionment circles denote individual values outside10th/90th percentiles circles denote 5th/95th percentiles
Organic Carbon Source Apportionment source categoriesstudy-average OC • resuspended soil (0.84 µg/m3; 21.8 %) • mobile sources (0.80 µg/m3; 20.7 %) • biomass combustion (0.53 µg/m3; 13.8 %) • secondary organic aerosol (0.43 µg/m3; 12.7 %) • industrial source #1 (0.27 µg/m3; 7.0 %) • industrial source #2 (0.09 µg/m3; 2.4 %) • winter combustion source #1 (0.25 µg/m3; 6.5 %) • winter combustion source #2 (0.18 µg/m3; 4.7 %) • residual (unapportioned OC) (0.46 µg/m3; 11.9 %)
Industrial Point Source #1 Indeno(cd)pyrene is a characteristic species in this factor… CPF for the resolved factor CPF for two-year daily time series of indeno(cd) pyrene
OC Source Apportionment - Discussion • Biomass burning: • PM2.5 mass apportionment 1.8 µg/m3 mass (PMF) • PM2.5 OC apportionment 0.9 µg/m3 OC (PMF) 1.2 µg/m3 OC (CMB) • OC apportioned to SOA should be considered a lower bound and it likely that the compounds included in the speciated organics data set are insufficient to capture to full range of SOA • Biogenic SOA from isoprene likely not captured because the reaction pathway does not yield compounds that are speciated in this work • Preliminary comparison of OC attribution from the mass apportionment and the OC apportionment (diagnostics purposes only)…
OC Attributions from PM2.5 Mass & OC Apportionments (diagnostic comparison) mobile; biomass burning model residual sulfate/nitrate; SOA
Urban/Rural Contrast in OC 2003-2006 (N = 361) for 0.9 mg/m3 blank correction, Bonne Terre is 60% of Bair
CPF for Excess PM2.5 Mass at Granite City compared to Margaretta (City of St. Louis)PM2.5 excess: mean = 3.2 mg/m3, median = 2.2 mg/m3
Fe and Mn as a Function of Excess PM2.5 Mass at Granite City Iron: assume bottom quartile mean iron is the urban baseline and iron is present as FeO2… average PM2.5 FeO2 from local sources is 0.8-0.9 mg/m3 (25-30% of excess PM2.5 mass at Granite City)
Demonstrating Attainment through SMAT Species Modeled Attainment Test (SMAT) • OBJECTIVE: Quantify impact of changes in emissions activities/controls on measured PM burdens • MODELING: Chemical Transport Modeling (CTM) to obtain relative response factors (RRF) for major PM components • sulfate, nitrate, EC, OC, other primary PM (OPP) • MEASUREMENTS: Apply the RRF values to the measured major PM components which have been reconciled to FRM mass Gloss over numerous the details, focus on the concept and its application to St. Louis...
SMAT: Reconciling Speciation & FRM Data • ISSUE: Reconstructed mass from routine speciation network data doe not match FRM mass • Nitrate loss from FRM filter • Particle bound water (PBW) not measured • Organic matter / organic carbon ratio (OM/OC) • Other positive and negative artifacts • APPROACH: Use the SANDWICH (Frank, 2006) methodology to estimate species loadings on FRM filter • Estimate retained nitrate (thermodynamic model with T & RH as input) • Adjust ammonium for nitrate loss • Estimate particle bound water from ion composition • Organic carbonaceous material by mass balance
SMAT: East St. Louis, 2002Q4 grav. mass grav. mass other filter blank OM = OCx1.8 (assumed multiplier) OM (by mass balance) EC EC OPP OPP ammonium particle water ammonium nitrate nitrate sulfate sulfate measured by speciation sampling
SMAT: East St. Louis, 2002Q4 grav. mass grav. mass other filter blank assigned to carbonaceous material OM = OCx1.8 (assumed multiplier) OM (by mass balance) EC EC OPP OPP ammonium particle water ammonium related to ions nitrate nitrate sulfate sulfate measured by speciation sampling estimate for Teflon filter (e.g., FRM)
SMAT: East St. Louis, 2002Q4 * through May 2003 only
SMAT: Application to St. Louis Monitors • East St. Louis • Current analysis is daily data with gravimetric mass by Harvard Impactors • Repeat with IEPA FRM data from this site • Granite City • No on-site routine chemical speciation • Three years of elemental analysis of FRM filters • SMAT using on-site FRM and elemental data • East St. Louis / Blair Street nitrate • Obtain total carbonaceous material (EC+OC) by mass balance
Summary • Big fans - really, really BIG FANS! • We have nearly 600A of power at the East St. Louis site!