Download
1 / 18
210 likes | 337 Views
How To Lie With Statistics. (not a how to guide). First Rule: Statistics Are Useful. Making generalizations from your friends or this one guy you know is not necessarily useful. Newspapers are not likely to have headlines that say "Released Prisoner Doesn't Commit Murder“

E N D
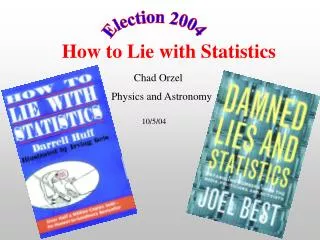
How To Lie With Statistics (not a how to guide)
First Rule: Statistics Are Useful • Making generalizations from your friends or this one guy you know is not necessarily useful. • Newspapers are not likely to have headlines that say "Released Prisoner Doesn't Commit Murder“ • What if an Olympic athlete drank tons of Vitamin C drinks?
Second Rule: Statistics Are Made up • 86% of statistics are made up numbers
Bad Sampling • What about finding five people who are racial minorities and also hate Obama? • What about if both times you met someone at a bar that you liked, you were wearing your lucky shirt?
Bad poll questions • Do you want to support health care for those who ruin their health with cigarettes? • Do you think government should help people when they are laid off for no fault of their own? • Do you support Obamacare?
Not accounting for other explanations • Employment is up! • Unemployment is up! • Can both be true?
Misleading trends – candy bar prices • January $ .76February $ .54March $ .51April $ .63May $ .80June $ .91July $ .76
Rankings • Fifth highest batter • Second highest grade in the class • Third leading cause of accidents in the home (carelessness, falling) • Diabetes might be said to be the third leading cause of death in the United States, but it's rank could change depending on whether cancer is considered one disease or many (lung cancer, breast cancer, colon cancer, etc.)
Percentages • Consider two companies: • 400,000 and 100 • They fired 10% of their employees. They fired 20,000 employees.
Spurious correlation • Ibuprofen and Alzheimer's
Spurious correlation • Inflation rate and which president is in charge – Democrats or Republicans • DUIs and churches
Question • What was wrong with the graph? • It does not say who Mary, Joe or Ann are. • It does not have values on the y axis. • No title. • All of the above.