Download
1 / 27
270 likes | 374 Views
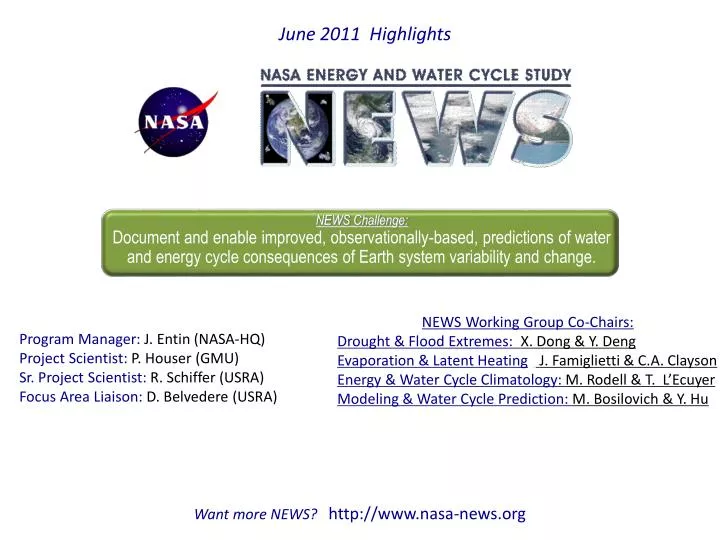
June 2011 Highlights. NEWS Challenge: Document and enable improved, observationally-based, predictions of water and energy cycle consequences of Earth system variability and change. NEWS Working Group Co-Chairs: Drought & Flood Extremes: X. Dong & Y. Deng

E N D
June 2011 Highlights NEWS Challenge: Document and enable improved, observationally-based, predictions of water and energy cycle consequences of Earth system variability and change. NEWS Working Group Co-Chairs: Drought & Flood Extremes: X. Dong & Y. Deng Evaporation & Latent Heating:J. Famiglietti & C.A. Clayson Energy & Water Cycle Climatology: M. Rodell & T. L’Ecuyer Modeling & Water Cycle Prediction: M. Bosilovich & Y. Hu Program Manager: J. Entin (NASA-HQ) Project Scientist: P. Houser (GMU) Sr. Project Scientist: R. Schiffer (USRA) Focus Area Liaison: D. Belvedere (USRA) Want more NEWS? http://www.nasa-news.org
The State of the Global Water Cycle Matt Rodell (NASA/GSFC), Tristan L’Ecuyer, Hiroko Kato Beaudoing, and the NEWS Water and Energy Cycle Climatology Team A comprehensive assessment of the global water and energy cycles is being carried out by a multi-institutional team of investigators supported by NASA’s Energy and Water Cycle Study (NEWS) program. Climate change will be felt most noticeably through its impacts on the water cycle, thus quantifying current mean water fluxes will be critical for detecting and understanding future changes. This initiative is unique in that it makes use of the most advanced observation based products, simultaneously constrains the water and energy budgets, thus reducing uncertainty in the results, and involves a cadre of experts from multiple institutions. Top: Global, mean annual water fluxes (x1,000 km3) at the start of the 21st century. Bottom: Monthly, continental fluxes of precipitation (black), evapotranspiration (red), and runoff (blue), and anomaly of terrestrial water storage (green) in thousands of km3.
Optimizing Surface and Atmospheric Energy Balance with NEWS Datasets Principal Investigator: T. S. L’Ecuyer (tristan@atmos.colostate.edu) Contributors: B. Lin, S. Kato, C. Clayson, E. Wood, W. Olson, M. Rodell, and H. Beaudoing The central goal of the NEWS Energy and Water Cycle Climatology Working Group is to provide the science community with an important summary of state-of-the art estimates of energy and water fluxes in the climate system based on current NASA satellite observations. Several NEWS datasets have integrated to document the annual cycle of the Earth’s energy budget on continental scales (see Figure). A rigorous optimization procedure has been applied to demonstrate that the surface energy budget can be balanced within the diagnosed uncertainties in the individual NEWS data products. Values of key surface energy fluxes before and after optimization are summarized in the Table providing a critical resource for evaluating energy balance in climate models. Figure: Globally-averaged surface energy balance prior to optimization. Globally, radiation inputs into the surface exceed latent and sensible heat by 19 Wm-2. L’Ecuyer, T. S. and the NEWS Energy and Water Cycle Climatology Working Group, 2011: “Observational Constraints on the Earth’s Energy Balance”, in preparation for BAMS. This study was made possible through the efforts of the NASA Energy- and Water- cycle Study that has been focusing for over five years on the difficult task of Integration of disparate, though connected through the water and energy cycle, NASA satellite and model data products. (see http://nasa-news.org) Table: Our best (optimal) observational estimates of surface energy balance from current satellite flux estimates. Original observations (from Figure 1) used in the optimization are presented for comparison. Values in parentheses are uncertainties.
Consistency of cloud properties observed from different times and locations Bing Lin, NASA Langley Research Center Above: Analyzed cloud areas (a) high clouds: storm tracks (1,2, 3, 4) and ITCZ (b) marine stratocumulus decks. Right: Similar top-of-atmosphere radiation fields for same types of clouds from different areas are observed. Results: There are large uncertainties in either modeled or observed cloud radiative properties. This study evaluated typical clouds in their persistent areas using CERES and MODIS measurements during 2003 to 2005. The seasonal variations of radiative fluxes for the same types of clouds from different areas, such as ITCZ, storm tracks and marine stratocumulus decks, are remarkably similar. Although cloud water contents vary considerably within individual cloud systems and from systems to systems, the statistical distributions at monthly or longer time scales for the same types of clouds are very consistent for different periods and areas. Regional differences in dynamics and thermodynamics can primarily cause changes in the cloud cover and only secondarily in the cloud water amounts and optical properties. These results establish a systematic approach of observations for testing modeled clouds and for improving cloud model parameterizations. Left: Consistent distributions of cloud ice amount (i.e., ice water path, IWP) for high clouds in storm tracks observed in June, July and August (left) and December, January and February (right) for 2003 (black), 2004 (red) and 2005 (green). Means and standard deviations are listed in the left and right columns, respectively, in each plot. Lin et al. Inter. J. Remote Sensing, 31, DOI: 10.1080/01431160903548005, 2010.
Analysis of NEWS Water Cycle Observations using Balance Constraints Bill Olson, Tristan L’Ecuyer, Matt Rodell, Hiroko Kato Beaudoing A fundamental question in global climate research is: “do our current estimates of the different processes in the earth’s water and energy cycles indicate a consistent, balanced state?” For example, based upon observations over a given region, does the import of moisture in the atmosphere by horizontal wind motions and by evaporation from the earth’s surface, less export by precipitation, balance the change in atmospheric moisture storage? Similarly, at the earth’s surface, does the flux of precipitation into the ground over a given region, less evaporation from the surface and runoff of water out of the region, balance the change in ground water storage? Using a combination of satellite and earth-based observations, the NEWS Climatology working group has evaluated these water cycle processes, but generally the component fluxes/storages do not balance exactly because of uncertainties in measurement techniques. The analysis method presented here is one approach for optimally adjusting the fluxes/storages within their uncertainties to obtain expected balance. Application: Jan.10-Year Mean North American Water Budget initial: Precip. = 4.78 ± .32 cm/mo.; Evap. = 1.13 ± .36 cm/mo.; Atmos. import = 2.02 ± 1.82 cm/mo.; Atmos. storage = -0.10 ± 0.02 cm/mo.; Runoff = 1.03 ± 0.28 cm/mo.; Ground stor. = 2.05 ± 0.20 cm/mo. balanced, in cm/month: Atmosphere Atm. Store: -.10 Atm. Import: 3.15 Precip: 4.60 Evap: 1.36 Grnd. Store: 2.11 Runoff 1.14 Analysis Method:the method of Lagrange multipliers is used to adjust water flux/storage terms to achieve regional balance in the atmosphere and at the earth’s surface simultaneously. If the observed fluxes/storages are represented by a vector Fobsand the “balanced” fluxes/storages are represented by F, and if the balance conditions are expressed KF = 0, where K is a matrix operator representing expected balance conditions for F, then is the Lagrangian that can be minimized (analytically) to obtain the “balanced” F and the Lagrange multipliers . The uncertainties in Fobs are included in the error covariance matrix Sobs. A general IDL code (with documentation) has been written to find F and for any number of input flux/storage terms and balance conditions. Earth Results and Implications: • analyzed (balanced) fluxes/storages are adjusted according to their relative uncertainties, and remain within these uncertainties. • results are consistent with OA framework implemented by T. L’Ecuyer. • water and energy cycles can be coupled in this solution framework. • regional (2D) and 3D budgets can also be coupled. • budget-constrained analyses could optimally combine both observations and reanalysis estimates. Bill Olson May 26, 2011
Inter-Annual Water Cycle Variations as Clues to Global Warming Processes Robert Adler and Guojun Gu (University of Maryland) This integrated, observational study improves our understanding of how inter-annual variations in the global hydrological cycle, specifically precipitation and tropospheric water vapor, depend on surface temperature changes, and how the ENSO and volcanic eruptions may modulate this dependence. Removal of the ENSO and volcano signals from the time series leaves evidence of large-scale temperature, vapor and precipitation inter-relations similar to those evident in global warming trends. This and following studies will provide better understanding of both inter-annual and climate-change variations in precipitation. Global (Land + Ocean) Inter-annual Lag Correlations Lag correlations (see figure) show strong link (correlation = 0.8) between global tropospheric water vapor lagging surface temperature by 1 month, while global precipitation lags by 2 months and has a weaker correlation (0.4) [solid red curves]. These relations are driven primarily by ENSO and secondarily by the 1991 Pinatubo eruption. The blue, dashed curves show results from the analysis of the same data after the ENSO and volcano signals are removed. While the precipitation/temperature correlations almost disappear (< 0.2), the water vapor/temperature relation still has a relatively strong relation (corr. 0.6), with a more peaked shape. These results (especially the blue dashed curves) resemble the water cycle responses under the global warming scenario, i.e., intense water vapor increases usually appear roughly following the Clausius-Clapeyron relation, but accompanied by relatively weak global-mean precipitation responses. Water Vapor vs.Ts Precipitation vs.Ts Water vapor lags Ts by ~ 1 month Precipitation lags Ts by ~ 2 months Full Data Full Data Without ENSO and volcano signals Without ENSO and volcano signals Lag-correlations of columnar water vapor (left panel) and precipitation (right panel) with surface temperature (Ts) over the globe land+ocean). Positive (negative) lags mean Ts lags (leads) two other components. Horizontal red and blue dotted lines denote thresholds of significant correlation Gu, G., and R. F. Adler, 2011: Large-scale, interannual relations among surface temperature, water vapor, and precipitation with and without ENSO and volcano forcings. International Journal of Climatology (accepted with minor revision)
Global streamflow from observations provides a window into consumptive water use Elizabeth Clark, Dennis Lettenmaier (University of Washington) Simulations of global streamflow generally ignore the human component of the water cycle. This study estimates global runoff to the oceans based on in situ gage observations following the methods of Dai et al. (2009, J. Climate). Because the furthest downstream gages integrate all upstream hydrologic processes, including consumptive use, we hypothesize that consumptive use can be extracted from the difference between simulated streamflow and our gage-based estimate. We estimate uncertainties associated with extrapolating observed streamflow to ungauged basins using a jackknife approach The difference between VIC-simulated streamflow and and observation-based estimates of streamflow, based on the method of Dai et al. (2009, J. Climate) is used to identify regions with high model bias (figures above). Biases are quantified for basins with minimal consumptive use of water (based on areas of low irrigated area, as shown to the left), and corrections are applied regionally. The difference between bias-corrected VIC streamflow and observation-based estimates provides an estimate of consumptive water use globally.
The role of surface radiative fluxes in pan-Arctic snow cover changesXiaogang Shi and Dennis P. Lettenmaier (University of Washington) North American and Eurasian snow cover have declined significantly in spring and summer over the period of satellite record beginning in the early 1970s (but not in winter). These trends are reproduced, both in trend direction and statistical significance, in reconstructions using the VIC model. We use the model reconstructions to investigate the energetics associated with the changes, and find that positive trends in net radiation accompany most of the trends, whereas model latent and sensible heat trends associated with warming mostly cancel each other, except for North America in Spring, and to a lesser extent Eurasia in Summer, when the sensible heat contribution to the trends is substantial. 9
Removing Artificial Trends in Bottom-Layer Precipitable Water Due to Earth Incidence Angle Trends Kyle Hilburn, Frank Wentz (Remote Sensing Systems), Chung-Lin Shie (UMBC/JCET) Earth Incidence Angle • When a satellite sensor looks down on the earth, the angle it makes with the up-and-down direction is called the “earth incidence angle” or “EIA” • What the sensor sees depends on EIA because the path through the atmosphere and the appearance of the surface both depend on EIA • TOP: EIA decreases over time for the six SSM/I satellites as they gradually fall in altitude; each has a different mean EIA • Failure to account for EIA trends can create artificial trends in parameters derived from the satellite observations • Removing EIA effects is difficult because the effects depend on the meteorological and oceanographic conditions • Through a collaboration between our two groups, we have developed a simple and accurate adjustment to remove EIA effects on microwave brightness temperature • MIDDLE: bottom-layer precipitable water (500 meter) retrievals before removing EIA effects, a large downward trend is apparent • BOTTOM: the same retrievals after removing EIA effects, the trend over the 23-year data record is nearly zero • This adjustment is being implemented in the Goddard Satellite-based Surface Turbulent Fluxes (GSSTF) dataset and two papers are in preparation BEFORE adjustment AFTER adjustment 6/2011
DIAGNOSIS OF AMAZON INTRA-BASIN SEASONAL DYNAMICS NOW POSSIBLE BY INTEGRATING MULTIPLE SATELLITE DATA PRODUCTS William B. Rossow, City College of New York Evaluation of multiple ET and P datasets, incl. NEWS products Discharge Lag Time estimated from NEWS Flooding Data Product Better Results Obtained than ever before BUT Improved ET requires better Surface Radiation and Ts – Ta values Improved Radiation and Temperatures for clear sky require re-processing temperature sounding data products (underway) Cloudy sky Radiation and Temperatures require merged IR and microwave analysis (underway) Work still needed to Complete Final Integration of Atmosphere-Surface Datasets to Quantify Energy & Water Exchanges at Land and Ocean Surfaces by combining multiple wavelength Satellite Products to obtain Diurnal, All-Weather time resolution
Reanalysis Data as a Science Integrator: MERRA and the Spring 2011 Floods Michael Bosilovich (NASA GSFC), Franklin R Robertson (MSFC) and Junye Chen (UMD ESSIC) Reanalysis systems, like MERRA, assimilate vast quantities of satellite and conventional observations into a physically-based modeling system. MERRA provides a wealth of fluxes and other variables not routinely observed at weather time scales over climatological periods. These observationally-constrained data can provide a complete picture of water and energy cycles. Since being released, MERRA data has been used by researchers in all of the NEWS working groups. During April 2011, record rainfall amounts occurred in the Midwest US and Ohio river basin. While the large scale weather pattern resembles the typical La Nina response, many states experienced the record monthly precipitation. Simultaneously, significant drought is occurring across west Texas, and long term persistent dry conditions exist along the gulf coastal land areas. MERRA provides internally consistent data that, when used with other NASA observations, can better explain the physical processes of weather and climate phenomena. In this way, MERRA can serve as a science integrator for NEWS and other science programs. Figure 1: April 2011 MERRA Precipitation (color) compared to that of TRMM (contour). MERRA slightly underestimates the observations, but produces a maximum in the appropriate location. This study was made possible in part through the NASA Energy and Water- cycle Study program ( http://nasa-news.org). MERRA has been developed at the Global Modeling and Assimilation Office (GMAO) supported by the Modeling, Analysis and Prediction program (MAP) [http://gmao.gsfc.nasa.gov/merra/]. Figure 2: April 2011 daily 2m Temp maximum anomaly (color) and vertically integrated moisture transport vectors. Large amounts of water are transported above a warm dry land surface destined for the region of extreme precipitation.
NASA MERRA Revealed Dynamical Organization of the North Pacific Atmospheric River Activity by East Asian Cold Surge Events Principal Investigator: Yi Deng (yi.deng@eas.gatech.edu) Atmospheric Rivers (ARs) are narrow regions of intense moisture transport in the troposphere that account for approximately 90% of the total meridional moisture transport in the extratropics. They are a primary feature of the global water cycle and are closely tied to water supply and flood risk in the western U.S. With the NASA MERRA data, this study for the first time revealed that the occurrence frequency of ARs over the eastern North Pacific is modulated by the East Asian cold surge events in wintertime. The circulation and wind anomalies dynamically excited by the low-temperatures of cold surge propagate eastward across the North Pacific and 3 to 5 days later create an environment favorable for the formation of ARs that can potentially make landfall at the U.S. west coast. East Asian cold surge thus serves as a remote forcing for the western U.S. hydrological extremes. This newly identified forcing provides additional dynamical ground for subseasonal prediction of AR activity as well as an observational benchmark for climate model evaluation. The connection between an energy cycle feature (temperature extremes) and a water cycle feature (hydrological extremes) discovered here shows the unique role the NASA NEWS played in integrating research efforts in the global energy cycle and water cycle. (a) (b) (c) (a) Atmospheric river Figure 2: Height anomalies (color shading, unit: m/k) and water vapor transport anomalies (vector, unit: m/s/k) on 850mb level 3 days (a), 4 days (b) and 5 days (c) after the peak of an East Asian cold surge event. All variables have been normalized by the temperature drop associated with the cold surge. Note the intense moisture transport over western North America associated with the negative (cyclonic) height anomalies that are originally excited by the cold surge over East Asia. (b) Atmospheric river Figure 3: Changes in the occurrence probability of AR over the North Pacific 3-5 days after an East Asian cold surge event. Note the significant rise of the occurrence chance of AR along the U.S. west coast. (c) Atmospheric river Figure 4: Evolution of the total water vapor (TQV) anomaly west of the U.S. coastline after the peak of an East Asian cold surge event (lag day 0). Note the significant rise of the level of TQV along the U.S. west coast due to the formation of ARs over the eastern Pacific around lag day 3 (see Figure 2 above). Unit: mm/k (TQV anomaly has been normalized by the temperature drop associated with the cold surge ). Figure 1: Three Atmospheric River (AR) events ((a) 10/13/2009, (b) 11/07/2006, (c) 01/09/2005) that produced extreme precipitation along the U.S. west coast as detected from the column integrated total water vapor (TQV) field of the NASA MERRA. Unit: mm.
Diagnosing the Local Land-Atmosphere Coupling in Models and Observations Joseph A. Santanello, Jr. and Christa D. Peters-Lidard (PI), NASA-GSFC Code 614.3 Project Successes and Deliverables for NEWS Phase-1 Development of a comprehensive framework for addressing local land-atmosphere coupling(‘LoCo’) at the process level and its impact on water and energy cycles, including: • LIS-WRF coupled system established as a community modeling testbed • A suite of LoCo diagnostics that can be applied to any model, scale, or observation (in-situ or satellite); e.g. Figs. 1-2 • Assessment of coupled model components and the impacts of each on the feedbacks governing soil moisture-PBL-clouds/precip interaction • Framework adopted by international agencies such as KNMI (NL), U. K. Met Office, and Univ. New South Wales (AUS) Figure 1.The diurnal evolution of T2m and q2m can be used to diagnose the land surface and PBL heat and moisture budgets (dashed), reflecting the balance reached for a particular LSM + PBL scheme coupling in LIS-WRF during the a) July 2006 and b) June 2007 extremes study. Dry Regime 7am Santanello, J. A. et al., 2009: A modeling and observational framework for diagnosing local land-atmosphere coupling on diurnal time scales. J. Hydromet., 10, 577-599. Santanello, J. A. et al., 2011: Diagnosing the Sensitivity of Local Land-Atmosphere Coupling via the Soil Moisture-Boundary Layer Interaction. J. Hydromet., in press. Figure 2.The total heat and moisture budgets derived from the mixing diagrams in Fig. 1 for the Dry (July 2006) case, for different Land-PBL scheme coupling (LSMs labeled) in LIS-WRF vs. observed. • Importance of LoCo Continuity under NEWS • NEWS and other community-based efforts (e.g. Landflux) have shown that current data and model products have significant uncertainty and spread in surface flux and other water and energy budget terms across global, continental, and regional scales. In order for improvements to be made in the proper translation of land surface states and anomalies (e.g. flood/drought) into atmospheric quantities (e.g. afternoon convection), a stronger understanding and diagnosis of coupled model components and physics must be acquired. This includes: • Timely application of the tools (models and diagnostics) developed in NEWS Phase-1 to provide a systematic exploration of LoCo and impacts on the water and energy cycle • Full exploitation across NEWS model and data assets (e.g. MERRA, AIRS, LIS-WRF) and Working Groups • Providing GEWEX-GLASS with a foundation for community-wide development of coupling metrics and global mapping of diagnostics • Priority Work for Next Phase • Evaluate the accuracy, variability, and limitations of land-PBL coupling in an array of NASA, NEWS and community model and observation products using the suite of LoCo diagnostics at global 'hotspots' of L-A interactions • Compare the radiances measured from AIRS as a benchmark against those from each of the model and observation products as generated from a satellite data simulator, for a range of land-PBL regimes and conditions (e.g. extremes) and as a function of their sensitivity to LoCo processes • Determine how errors in components of LoCo (e.g. ET, PBL depth) translate into differences in radiance signatures using statistical techniques, and extend analysis to the global coverage of AIRS
The NASA-Goddard Multi-scale Modeling Framework-Land Information System: A global modeling system with resolved convection and Deliverables for NEWS Phase-1 K. I. Mohr, W.-K. Tao, J.-D. Chern, S.V. Kumar, and C.D. Peters-Lidard (PI), NASA-GSFC CMORPH, 0.25°2.52 mm/day Figure 1. (below) A schematic of the coupling of the three MMF-LIS components. Arrows indicate input and output of atmospheric and land surface states among components. Project Successes The Multi-scale Modeling Framework (MMF) replaces the cumulus parameterization in a finite-volume GCM (GEOS-4) with a cloud-resolving model (GCE) to explicitly resolve cumulus clouds. This work included • Coupling the MMF to the Land Information System (LIS), a multi-model land data assimilation system to create the MMF-LIS; • Assessing the sensitivity of regional and global atmospheric circulations to the integrated impact of cloud and land surface processes; • Conducting 2-year global simulations (2007-2008) and comparing MMF-LIS results to global gridded datasets and reanalysis. MERRA, 1.251°3.25 mm/day MMF-LIS, CLM 2.0, 2. 52°3.13 mm/day Tao, W.-K., et al., 2009. A multiscale modeling system: Developments, applications, and critical issues. Bulletin of the American Meteorological Society, 90, 515-534. Mohr, K.I., W.-K. Tao, J.-D. Chern, S.V. Kumar, C.D. Peters-Lidard, 2011: The NASA-Goddard multi-scale modeling framework-Land Information System: A global modeling system with resolved convection, Environmental Modeling and Software, submitted. Figure 2. (right) Global mean daily precipitation for June to August 2007 with map views and latitudinal cross sections of CMORPH, MERRA, and two free-running simulations of MMF-LIS using different versions of the Common Land Model. A singular advantage of MMF-LIS is the ability to use multiple land surface models to study land-atmosphere interactions. MMF-LIS, CLM 2.1, 2. 52°3.12 mm/day • Importance of MMF-LIS Research Continuity under NEWS • NEWS and other community-based efforts have shown that current data and model products have significant uncertainty and spread in precipitation and other water and energy budget terms, particularly across global scales. The MMF-LIS enhances our ability to investigate the integrated impact of small-scale cloud microphysics and soil and vegetation states on regional to global-scale circulations, cloud patterns, and precipitation. This work demonstrated the value of • The use of a cloud-resolving model as a GCM “super-parameterization”, capable of resolving convection globally; • Integrating and coupling three complex model components to achieve a computationally efficient global model framework that can be run at resolutions ranging from 0.5°to 2°and • The multi-model capability of LIS in understanding the sensitivity to land surface processes at regional and global scales. • Priority Work for Next Phase • Provide MMF-LIS output (2006-2008) across NEWS working groups. • Determine if differences between MMF-LIS and observational datasets are attributable to model physics, particularly in areas known to be problematic in large-scale models (e.g., diurnal cycles, precipitation intensity spectra, tropical and extra-tropical waves). • Identify improvements and capabilities needed, based on the analysis by our group and from feedback from Working Groups.
Modeled downward radiative flux at the surface from the atmosphere increases due to CALIPSO CloudSat derived cloud base(PIs: B. Wielicki and S. Kato: seiji.kato@nasa.gov), http://eosweb.larc.nasa.gov/PRODOCS/ceres-news/table_ceres-news.html Active sensor (CALOPSO and CloudSat) derived cloud base heights and cloud fraction help to reduce the surface flux uncertainty, especially over polar regions. The global annual mean downward longwave flux is 347 Wm-2, which increases by 1% (3.4 Wm-2) compared with the radiative flux computed without the active sensors Wm-2 Cloud fraction, MODIS – CALIPSO CloudSat The annual mean surface downward longwave radiative flux computed with active sensor (CALIPSO and CloudSat) minus the irradiance computed without active sensors (MODIS only) derived cloud vertical profiles. Non-polar regions Polar regions Global Jan. Apr. June Oct. Jan. Apr. June Oct. Annual Cloud base height, MODIS – CALIPSO CloudSat Global Annual mean radiative flux Polar regions Non-polar regions Global Jan. Apr. June Oct. Jan. Apr. June Oct. Annual Surface downward longwave flux difference MODIS – CALIPSO CloudSat Non-polar regions Polar regions Global Kato, S., F. G. Rose2, S. Sun-Mack, W. F. Miller, Y. Chen, D. A. Rutan, G. L. Stephens, N. G. Loeb, P. Minnis, B. A. Wielicki, D. M. Winker, T. P. Charlock, P. W. Stackhouse Jr, K.-M. Xu , and W. D. Collins, 2011: Computation of top-of-atmosphere and surface irradiances with CALIPSO, CloudSat, and MODIS-derived cloud and aerosol properties, submitted to J. Geophys. Res. Jan. Apr. June Oct. Jan. Apr. June Oct. Annual
The Recently Revived Satellite-based Global Ocean Surface Turbulent Fluxes Datasets and Impact of the SSM/I Brightness Temperature The Recently Revived Satellite-based Global Ocean Surface Turbulent Fluxes Datasets and Impact of the SSM/I Brightness Temperature Chung-Lin Shie (UMBC, GSFC), Long Chiu (GMU), Robert Adler (UMCP, GSFC), et al. & Kyle Hilburn (RSS) and Frank Wentz (RSS) Chung-Lin Shie (UMBC, GSFC), Long Chiu (GMU), Robert Adler (UMCP, GSFC), et al. & Kyle Hilburn (RSS) and Frank Wentz (RSS) Accurate air-sea surface turbulent flux measurements are crucial to understanding the global water and energy cycle changes. Remote sensing is a valuable tool for global monitoring of these flux measurements. The Goddard Satellite–based Surface Turbulent Fluxes Version 2b (GSSTF2b) dataset (global 1x1 degree; July 1987- December 2008) based mainly on the SSM/I V6 brightness tempera- ture (Tb) and the NCEP-DOE reanalysis has recently been produced and distributed through the efforts of a MEaSUREs funded project (Fig. 1). GSSTF2b was found as one of the best performing products among the 11 flux products accessed (a study led by M. Brunke at U. Arizona). Note that the assessment applied the available cruise observations during 1991-1999 that were before a temporal trend of the globally averaged latent heat flux became apparent, especially post 2000. This temporal trend has recently been found correlated to a similar trend of the SSM/I V6 Tb that is later found primarily due to the variations of SSM/I incidence angles. We are currently in producing an updated version (GSSTF2c) using the properly corrected Tb. Our preliminary results show a promising improvement in the latent heat flux trend after the correction (Fig. 2). Accurate air-sea surface turbulent flux measurements are crucial to understanding the global water and energy cycle changes. Remote sensing is a valuable tool for global monitoring of these flux measurements. The Goddard Satellite–based Surface Turbulent Fluxes Version 2b (GSSTF2b) dataset (global 1x1 degree; July 1987- December 2008) based mainly on the SSM/I V6 brightness tempera- ture (Tb) and the NCEP-DOE reanalysis has recently been produced and distributed through the efforts of a MEaSUREs funded project (Fig. 1). GSSTF2b was found as one of the best performing products among the 11 flux products accessed (a study led by M. Brunke at U. Arizona). Note that the assessment applied the available cruise observations during 1991-1999 that were before a temporal trend of the globally averaged latent heat flux became apparent, especially post 2000. This temporal trend has recently been found correlated to a similar trend of the SSM/I V6 Tb that is later found primarily due to the variations of SSM/I incidence angles. We are currently in producing an updated version (GSSTF2c) using the properly corrected Tb. Our preliminary results show a promising improvement in the latent heat flux trend after the correction (Fig. 2). Figure 1: GSSTF2b latent heat flux (Wm-2) January (top) andJuly (bottom)monthly climatology (1988-2008) Figure 1: GSSTF2b latent heat flux (Wm-2) January (top) andJuly (bottom)monthly climatology (1988-2008) The Recently Revived Satellite-based Global Ocean Surface Turbulent Fluxes Datasets and Impact of the SSM/I Brightness Temperature Chung-Lin Shie (UMBC, GSFC), Long Chiu (GMU), Robert Adler (UMCP, GSFC), et al. & Kyle Hilburn (RSS) and Frank Wentz (RSS) • Relevance to NASA Goals: • The GSSTF air-sea fluxes contribute to improved understanding of the air-sea interaction, global and regional energy and water cycle variability, as well as to improving model simulations of climate variations. • The correction of brightness temperature ensures the validity of the long-term and consistent GSSTF products retrieved from across multiple SSM/I satellite sensors. • Relevance to NASA Goals: • The GSSTF air-sea fluxes contribute to improved understanding of the air-sea interaction, global and regional energy and water cycle variability, as well as to improving model simulations of climate variations. • The correction of brightness temperature ensures the validity of the long-term and consistent GSSTF products retrieved from across multiple SSM/I satellite sensors. Accurate air-sea surface turbulent flux measurements are crucial to understanding the global water and energy cycle changes. Remote sensing is a valuable tool for global monitoring of these flux measurements. The Goddard Satellite–based Surface Turbulent Fluxes Version 2b (GSSTF2b) dataset (global 1x1 degree; July 1987- December 2008) based mainly on the SSM/I V6 brightness tempera- ture (Tb) and the NCEP-DOE reanalysis has recently been produced and distributed through the efforts of a MEaSUREs funded project (Fig. 1). GSSTF2b was found as one of the best performing products among the 11 flux products accessed (a study led by M. Brunke at U. Arizona). Note that the assessment applied the available cruise observations during 1991-1999 that were before a temporal trend of the globally averaged latent heat flux became apparent, especially post 2000. This temporal trend has recently been found correlated to a similar trend of the SSM/I V6 Tb that is later found primarily due to the variations of SSM/I incidence angles. We are currently producing an updated version (GSSTF2c) using the properly corrected Tb. Our preliminary results show a promising improvement in the latent heat flux trend after the correction (Fig. 2). Figure 2. Time series of the globally averaged latent heat flux (Wm-2) for GSSTF2c (solid line) and GSSTF2b (dot dot dash line), where F13 and F14are in red and green, respectively. F13is plotted from Jan 1998 to Dec 2008, while F14 is up to Aug 2008. Figure 2. Time series of the globally averaged latent heat flux (Wm-2) for GSSTF2c (solid line) and GSSTF2b (dot dot dash line), where F13 and F14are in red and green, respectively. F13is plotted from Jan 1998 to Dec 2008, while F14 is up to Aug 2008. GSSTF2b website: http://disc.sci.gsfc.nasa.gov/daac-bin/DataHoldingsMEASURES.pl?PROGRAM_List=ChungLinShie GSSTF2b website: http://disc.sci.gsfc.nasa.gov/daac-bin/DataHoldingsMEASURES.pl?PROGRAM_List=ChungLinShie Figure 1: GSSTF2b latent heat flux (Wm-2) January (top) andJuly (bottom) monthly climatology (1988-2008) • Relevance to NASA Goals: • The GSSTF air-sea fluxes contribute to improved understanding of the air-sea interaction, global and regional energy and water cycle variability, as well as to improving model simulations of climate variations. • The correction of brightness temperature ensures the validity of the long-term and consistent GSSTF products retrieved from across multiple SSM/I satellite sensors. Figure 2. Time series of the globally averaged latent heat flux (Wm-2) for GSSTF2c (solid line) and GSSTF2b (dot dot dash line), where F13 and F14 are in red and green, respectively. F13is plotted from Jan 1998 to Dec 2008, while F14 is up to Aug 2008. GSSTF2b website: http://disc.sci.gsfc.nasa.gov/daac-bin/DataHoldingsMEASURES.pl?PROGRAM_List=ChungLinShie
Satellite Data Give Insights on Performance of Models of Water and Energy Transfer at Land Surfaces Principal Investigator: Alan Lipton Climate and weather forecasts rely on complex land surface models to account for surface evaporation and other mechanisms of energy and water transfer. We have used neural networks to estimate modeled energy transfer by evaporation and condensation (latent heat flux) from an integration of several types of satellite data from EOS Aqua and other sources. Maps show variations in how consistent are the satellite estimates and the model results, and data from sites with measurement towers shed light on the reasons for the differences. Identification of systematic differences is helpful for improving models and their incorporation of information from satellite data. Model latent heat flux July 2003 Alberta Saskatchewan Montana Satellite detects surface temperature rise as latent heat transfer diminishes across the month Satellite-derived latent heat flux July 2003 Energy transfer by latent heat flux at Lethbridge, AB, July 2003 Lethbridge July averages from Satellite Tower Model Measurements from tower Day-night differences in land surface temperature are indicative of flow of energy from sunlight into evaporation versus warming of surface and air. The day-night difference tends to be higher where there is less vegetation, and we have found this tendency is much stronger in satellite (AMSR-E) data than with a model (NOAH) data. We are investigating reasons for the difference and the implications. AMSR-E satellite-derived land surface temperature day-night difference NOAH land surface model land surface temperature day-night difference Air temperature from tower day nightSatellite (AMSR-E) surface temperature tracks daily and monthly trends Index of Amount of Vegetation, from MODIS (EVI) Index of Amount of Vegetation, from MODIS (EVI)
Extreme Mid-Latitude Cyclones Make a Large Contribution to Basin Average Ocean Surface Fluxes Mark Bourassa, Carol Anne Clayson, and Joel Scott (Florida State University) Surface turbulent fluxes of energy (latent heat and sensible heat) were examined for a type of large and strong extra-tropical cyclones know as warm seclusions. Our study (1) examined what part of the storm life cycle had the very large fluxes, and (2) found the contribution that a single storm can make to monthly averaged fluxes for several ocean basins. Individual storms can produce roughly 25% of surface turbulent fluxes, despite covering a much smaller fraction of the space/time. On average, more than two such storms occurred per ocean basin in Winter months. Accurate representation of these storms is critical for energy and moisture budgets. 156 150 144 138 132 126W The very strong latent (top) and sensible (bottom) heat fluxes occurred during the mature phase of the cyclone life cycle. During this phase, a second strong cold front has overtaken the system, and the very large area of strong surface turbulent fluxes trails the cold front. The cold and dry air behind the cold front, coupled with strong winds, leads to the very strong turbulent fluxes. Preliminary results suggest that these storms could be particularly important in the Southern Ocean, where western boundary currents make only a small contribution to the basin averaged fluxes. 156 150 144 138 132 126W The red dot indicates the center of the cyclone near the time of the satellite overpasses., and the black like shows the cyclone track .The gaps in the images are due to gaps between satellite tracks and rainfall that is too great for accurate retrievals.
Examination of Model Representation of Surface Turbulent Fluxes of Extreme Mid-Latitude Cyclones Mark Bourassa, Carol Anne Clayson, and Joel Scott (Florida State University) Surface turbulent fluxes of energy (latent heat and sensible heat) associated with warm seclusions (strong extra-tropical cyclones) were found to be important for basin-wide budgets of energy and moisture. Satellite estimates of these surface fluxes are determined from satellite observations, and compared to four reanalyses and the SeaFlux (v0.75) interpolated product. The reanalysis products are ERA40, NCEPR2, CFSR, and MERRA. The model representations of surface wind, temperature, and humidity were also examined in an effort to explain differences in magnitude. These variables were used in a bulk flux algorithm to determine the turbulent surface fluxes. Care was taken to treat the satellite winds (equivalent neutral winds) in a manner physically consistent with traditional winds. The ERA40, CFSR and MERRA product had relatively good spatial representation of the trailing cold front; however, the low MERRA wind speeds were a large factor in underestimating the fluxes. NCEPR2 lacks the resolution needed to represent the cyclone, and blurs the cold front. The SeaFlux v0.75 interpolated fluxes have more variable accuracy. The bias adjusted satellite-derived fluxes in the lower right are considered the standard for comparison. The red dot indicates the center of the cyclone near the time of the satellite overpasses., and the black like shows the cyclone track .The gaps in the images are due to gaps between satellite tracks and rainfall that is too great for accurate retrievals. Note that we did not compare the fluxes provided with the reanalysis products, as they are considered less reliable than fluxes estimated with a good bulk method. The red box matches the area shown for the satellite retrievals.
Publication on Viability of Satellite Retrievals of Surface Turbulent Fluxes and Accuracy Requirements Mark Bourassa (Florida State University), Gary Wick and Darren Jackson (NOAA/CSU) Surface turbulent fluxes of energy (latent heat and sensible heat) are crucial parts of the coupled climate system. Over most of the global oceans the in situ observing system has grossly insufficient sampling to provide accurate estimates of these fluxes. New satellite-based retrieval techniques for near surface air temperature and humidity (developed by SeaFlux) are combined with wind retrievals, and used in a bulk method to determine surface turbulent energy fluxes and evaporation. The accuracy of the input data is shown to be of similar quality to the in situ data over the vast majority of the parameter space. Consequently, the satellite-based fluxes result in great improvements in accuracy over most of the global oceans. Satellite-based retrievals of 10m air temperature and humidity The paper describes the accuracy requirements for a wide range of climate-related processes. It does not address the sampling requirements; however, subsequent work suggests that diurnal variability in the winds alone would necessitate at least four satellites in harmonized orbits to meet the requirements for accuracy required from multi-decadal trend analysis. The paper does discuss options for improving accuracy on future satellites, suggestion that the proposed GCOM-W2 mission, with a scatterometer and an AMSR2 instrument on the same platform could be a substantial improvement. Bourassa, M., S. Gille, D. L. Jackson, B. J. Roberts, and G. A. Wick, 2010: Ocean Winds and Turbulent Air-Sea Fluxes Inferred From Remote Sensing. Oceanography, 23, 36-51 The new flux estimates are improvements over the original SeaFlux retrievals in two ways. First, the satellite wind speeds are treated as equivalent neutral winds, which is a proxy for surface stress, rather than as traditional winds. Typical changes are in the range of 5-10Wm-2, which is important for many applications. Secondly, the moisture roughness length has been modified to better account for noise in the in situ tuning data, resulting in roughly 10 Wm-2 change in the tropics, which is important to interannual applications.
NASA NEWS Drought and Flood Extremes Publications Principal Investigator: Xiquan Dong (dong@aero.und.edu) • 1) Dong, X., B. Xi, K. Crosby, C.N. Long, R. Stone and M. Shupe, 2010: A 10-yr Climatology of Arctic Cloud Fraction and Radiative Forcing at Barrow, Alaska. J. Geophys. Res., 115, D12124, doi:10.1029/2009JD013489. • 2) Xi, B. and X. Dong, P. Minnis, M. M. Khaiyer, 2010: A 10-year climatology of cloud cover and vertical distribution derived from both surface and GOES observations over the DOE ARM SGP Site. J. Geophys. Res.115, D12124 doi:10.1029/2009JD012800. • 3) Dong, X., B. Xi, A. Kennedy, Z. Feng, J. Entin, P. Houser, B. Schiffer, W. Olson, T. L’Ecuyer, T. Liu, K-L Hsu, B. Lin, Y. Deng, and T. Jiang, 2011: Investigation the 2006 Drought and 2007 Flood Extreme Events at the SGP through an Integrative Analysis of Observations. J. Geophys. Res. 116, D03204, doi:10.1029/2010JD014776. • 4) Kennedy, A.D., X. Dong, B. Xi. S. Xie, Y. Zhang, and J. Chen, 2011: A Comparison of MERRA and NARR Reanalysis Datasets with the DOE ARM SGP Continuous Forcing data. ate. J. Climate In Press. • 5) Zib, B., X. Dong, and B. Xi, A. Kennedy, 2011: Evaluation and Intercomparison of Cloud Fraction and Radiative Fluxes in Recent Reanalyses over the Arctic using BSRN Surface Observations. J Climate Accepted. • 6) Wu, D, X. Dong, B. Xi, Z. Feng, A. Kennedy, G. Mullendore, and M. Gilmore, 2011: The Impact of WRF Microphysics Parameterizations on Squall-line Precipitation. Submitted to J. Geophys. Res. • 7) Feng,Z., X, Dong, B. Xi, C. Schumacher, P. Minnis, and M. Khaiyer, 2011: TOA Radiation Budget of Convective Core/Stratiform Rain and Anvils from Deep Convective Clouds. Submitted to J. Geophys. Res.
A Study of Arctic Clouds and Radiation Budget Supported by NASA NEWS Project Principal Investigator: Xiquan Dong (dong@aero.und.edu) The recent climate modeling results have revealed that the largest disagreement between climate model simulations of present-day climate is found in the Arctic region. To provide more observational evidence relatedto these investigations of Arctic clouds and their impact on surface radiation budget, a 10-yr record of Arctic cloud fraction and radiative forcing has been generated using data collected at the Atmospheric Radiation Measurement (ARM) North Slope of Alaska (NSA) site and the nearby NOAA Barrow Observatory (BRW) from June 1998 to May 2008. Long term analysis results indicate that the annual cloud coverage is about 0.778 with a minimum of 0.574 in March and a maximum of 0.965 in September. Compared with other studies, it was also found that infrared heating by clouds does not change over the Arctic regions significantly, but the total cloud induced radiative heating changes from negative to positive from Alaska to the Beaufort Sea. This result indicate that Barrow is near the critical latitude for which cloud induced infrared radiative heating is in appromxiate balance by that changes in cloud induced solar radiation. These results should be valuable for enabling climate modelers to quantitaively evaluate climate model simulations over the Arctic region, leading to identification of source for modeling errors and possible cloud-radiation formulation improvements. Figure 1: Monthly means of cloud fractions derived from (a) ARM NSA radar-lidar measurements during the period 1999-2004, and (b) ARM NSA ceilometer measurements during the period of June 1998-May 2008. Figure 2: Monthly means of all-sky (a) SW, (b) LW, and (c) NET Cloud Radiative Forcings (CRF) at the ARM NSA and NOAA BRW sites, 06/1998-05/2008. The clear-sky SW-down and up, and LW-down values were estimated using the empirical fitting techniques, and LW-up values are averaged all clear-sky LW-up measurements during the 10-yr period. Masunaga, H. and T. S. L’Ecuyer, 2010a: “The Southeast Pacific Warm Band and Double ITCZ”, J. Climate 23, 1189-1208. Masunaga, H. and T. S. L’Ecuyer, 2010b: “Equatorial Asymmetry of the East Pacific ITCZ: Observational Constraints on the Underlying Processes”, submitted to J. Climate. Dong, X., B. Xi, K. Crosby, C.N. Long, R. Stone and M. Shupe, 2010: A 10-yr Climatology of Arctic Cloud Fraction and Radiative Forcing at Barrow, Alaska. J. Geophys. Res., 115, D17212, doi:10.1029/2009JD013489 (Published Sept. 15, 2010)
NASA NEWS Phase-I datasets were used to study the SGP extreme events Principal Investigator: Xiquan Dong (dong@aero.und.edu) HY 06 and HY07 provide a unique opportunity to examine hydrological extremes in the central US because there are no other examples of two such highly contrasting precipitation extremes occurring in consecutive years at SGP in recorded history. The HY06 annual precipitation is 61% of the normal and ranks as the second-driest year. On the other hand, the HY07 annual precipitation amount is 121% of the normal and ranks as the seventh-wettest year. The HY06 drought was dominated by large-scale dynamic pattern, while the HY07 precipitation events were initially generated by active synoptic weather patterns, linked with moisture transport from the Gulf of Mexico by the northward low level jet, and enhanced the frequency of thunderstorms and their associated latent heat release. Two positive feedback processes were found to play key certain roles to maintain and reinforce the length and severity of existing drought and flood events. Dong, X., B. Xi, A. Kennedy, Z. Feng, J. Entin, P. Houser, B. Schiffer, W. Olson, T. L’Ecuyer, T. Liu, K-L Hsu, B. Lin, Y. Deng, and T. Jiang, 2011: Investigation the 2006 Drought and 2007 Flood Extreme Events at the SGP through an Integrative Analysis of Observations. J. Geophys. Res. 116, D03204, doi:10.1029/2010JD014776. (Published Feb. 4, 2011)
How to reconcile surface and satellite observations? Principal Investigator: Xiquan Dong (dong@aero.und.edu) The assumed or computed vertical structures of cloud occurrence in General Circulation Models (GCMs) are one of the main reasons why the different models predict a wide range of future climates. The nearly continuous observations by the DOE Atmospheric Radiation Measurement (ARM)Program cloud radar-lidar systems can provide more accurate cloud vertical distributions and compensate for most of the shortcomings in cloud vertical distributions from both surface observers and satellite imagery. However, the limitation of such observing systems is that they view only a small column of the atmosphere above the instruments providing only a pencil beam. How accurately the surface-based narrow radar-lidar field-of-view observations represent the large grid boxes used in GCMs remains an unresolved issue. Researchers from University of North Dakota and NASA Langley used one decade of radar-lidar and GOES observations at the ARM SGP site to address this issue, and provided what parameters are (not) comparable between surface and satellite observations. These results should provide the most complete statistics, to date, of the long-term average cloud fraction and vertical distributions of clouds over the climatically important SGP site. These statistics can be used as ground truth for both surface observers and satellite researchers to quantitatively understand and explain the differences between their observations and cloud truth. They should also be valuable for advancing our understanding of the vertical distributions of clouds and for enabling climate/forecast modelers to more fully evaluate their simulations and improve their parameterizations over the SGP Central Facility. Fig. 1. Dependence of (a) cloud frequency of occurrence (FREQ), (b) amount when present (AWP) and (c) cloud fraction (CF) on temporal resolutions of ARM surface radar/lidar observations during the period 1997-2006, and on grid boxes of satellite observationsduring the period from May 1998 to December 2006 at the ARM SGP site. Fig. 2. Mean vertical distributions of CF derived from the ARM radar-lidar observations with a 5-min temporal resolution and vertical resolutions of 90 m, 250 m, 500 m, and 1000 m at the ARM SGP site, 1997- 2006. Masunaga, H. and T. S. L’Ecuyer, 2010a: “The Southeast Pacific Warm Band and Double ITCZ”, J. Climate 23, 1189-1208. Masunaga, H. and T. S. L’Ecuyer, 2010b: “Equatorial Asymmetry of the East Pacific ITCZ: Observational Constraints on the Underlying Processes”, submitted to J. Climate. Xi, B., X. Dong, P.Minnis, M. M. Khaiyer, 2010: A 10-year climatology of cloud cover and vertical distribution derived from both surface and GOES observations over the DOE ARM SGP Site. J. Geophys. Res. 115, D12124, doi:10.1029/2009JD012800. (Published June, 2010)
Extreme Rainfall Events over the US Great Plains (USGP) during the Last Decade This study focuses on identifying extreme warm season (April-September) rain events over the central US Great Plains (100°-95°W and 35°-45° N) using NASA’s multi-satellite measurements (TRMM-3B42) and understanding atmospheric processes associated with these events using North American Regional Reanalysis (NARR) Northward wind at 925 hPa level (top) and eastward wind at 200 hPa (bottom) from NARR (Difference between 2008 and 2006 April-September seasonal values) Extreme Rain Frequency: Number of days exceeding the 95 percentile value Extreme Event: When daily rain amount exceeds 95 percentile value from 2000-2009 daily rain measurements (spatial resolution: approximately 25x25 km2 area) within the USGP Figure 2: Extreme warm season rain frequency over the last decade range from 1-10 days exhibit spatial coherence and substantial inter-annual variability On the average extreme rain events cover 1-2% area of the USGP per day The rain frequency was minimum in 2006 and maximum in 2008 Figure 3: Eastward shift in low-level northward wind jet (top) and southward shift in upper level eastward wind jet (bottom) in 2008 compared to 2006 suggest large-scale dynamical controls on the extreme rain frequency over the USGP Figure 1: 95 percentile value > 35 mm/day over eastern Great Plains with much larger values (> 50mm/day) over southeastern region This study is supported in part by NASA Energy and Water Cycle Studies Program Theme: Drought and Flood Extremes Amita Mehta and Eric Smith amita.v.mehta@nasa.gov 6/2011
Identifying Controls and Predictability of Extreme Drought Persistence PI: John D. Albertson (john.albertson@duke.edu); Co-I: Amilcare Porporato This study focuses on connecting each diurnal cycle to analyze land-atmosphere interaction in dry season. We also cooperate with Santanello on mixing diagram through mixed layer model equations. To connecting diurnal cycles, we study the transition between afternoon sounding profiles and next morning ones. To analyze mixing diagram, we start from basic equations to derive each magnitude. With long series ABL evolution and tools for analyzing land atmosphere interaction, the controls and predictability of drought persistent can then be identified. Fig. 2 Vectors in mixing diagram. Red is surface flux, blue is entrainment, and violet is advection. Left is two-vector diagram in which advection is neglected, right is three-vector diagram. The left is derived from analytical solutions of mixed layer model (Porporato 2009). The right is derived from conservation of energy and humidity equations. It is necessary to compare the mixing diagram calculated from WRF output and from local observation data. Local land atmosphere interaction will be coupled to large scale climate system through advection and further drought mechanism would be identified. Fig. 1 Comparisons of average temperature (left) and humidity (right) below ABL between late afternoon and next early morning in CF-SGP site. For temperature transition, a 1.7 K cooling can be found. For humidity transition, no consistent change is recognized. Advections can account for the scatter patterns. Porporato, A. (2009). "Atmospheric Boundary-Layer Dynamics with Constant Bowen Ratio." Boundary-Layer Meteorology 132(2): 227-240. Santanello, et al. (2009). "A Modeling and Observational Framework for Diagnosing Local Land-Atmosphere Coupling on Diurnal Time Scales." Journal of Hydrometeorology 10(3): 577-599.