Download
1 / 9
90 likes | 242 Views
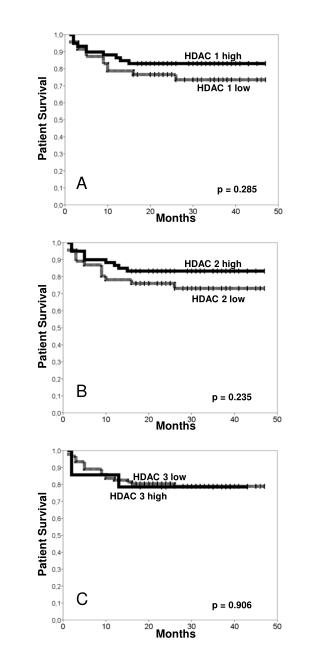
Supplementary Figure 2: Representative Kaplan-Meier plots of overall survival considering alterations erbB signaling pathway genes and p53 in lung cancer patients. P values were calculated using logrank test.

E N D
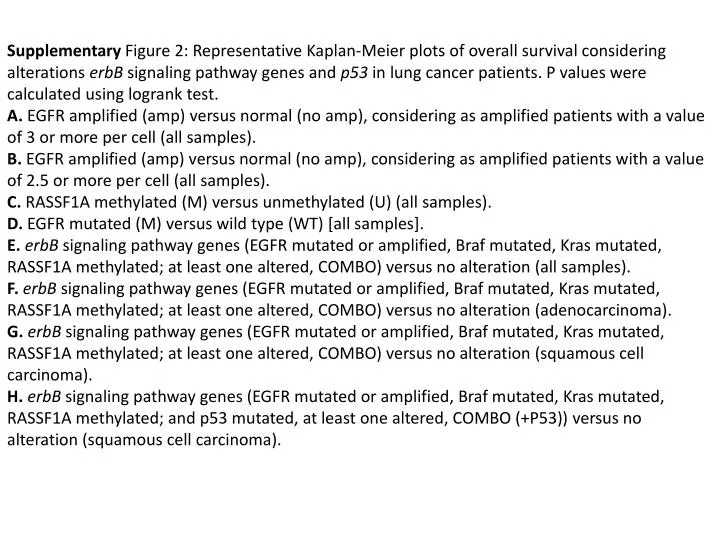
Supplementary Figure 2: Representative Kaplan-Meier plots of overall survival considering alterations erbB signaling pathway genes and p53 in lung cancer patients. P values were calculated using logrank test. A. EGFR amplified (amp) versus normal (no amp), considering as amplified patients with a value of 3 or more per cell (all samples). B. EGFR amplified (amp) versus normal (no amp), considering as amplified patients with a value of 2.5 or more per cell (all samples). C. RASSF1A methylated (M) versus unmethylated (U) (all samples). D. EGFR mutated (M) versus wild type (WT) [all samples]. E. erbB signaling pathway genes (EGFR mutated or amplified, Braf mutated, Kras mutated, RASSF1A methylated; at least one altered, COMBO) versus no alteration (all samples). F. erbB signaling pathway genes (EGFR mutated or amplified, Braf mutated, Kras mutated, RASSF1A methylated; at least one altered, COMBO) versus no alteration (adenocarcinoma). G. erbB signaling pathway genes (EGFR mutated or amplified, Braf mutated, Kras mutated, RASSF1A methylated; at least one altered, COMBO) versus no alteration (squamous cell carcinoma). H. erbB signaling pathway genes (EGFR mutated or amplified, Braf mutated, Kras mutated, RASSF1A methylated; and p53 mutated, at least one altered, COMBO (+P53)) versus no alteration (squamous cell carcinoma).
A. EGFR amplified (amp) versus normal (no amp), considering as amplified patients with a value of 3 or more per cell (all samples). P=0.64 Months
B. EGFR amplified (amp) versus normal (no amp), considering as amplified patients with a value of 2.5 or more per cell (all samples). P=0.38 Months
C. RASSF1A methylated (M) versus unmethylated (U) (all samples). P=0.99 Months
D. EGFR mutated (M) versus wild type (WT) [all samples]. P=0.64 Months
E. erbB signaling pathway genes (EGFR mutated or amplified, Braf mutated, Kras mutated, RASSF1A methylated; at least one altered, COMBO) versus no alteration (all samples). P=0.63 Months
F. erbB signaling pathway genes (EGFR mutated or amplified, Braf mutated, Kras mutated, RASSF1A methylated; at least one altered, COMBO) versus no alteration (adenocarcinoma) P=0.74 Months
G. erbB signaling pathway genes (EGFR mutated or amplified, Braf mutated, Kras mutated, RASSF1A methylated; at least one altered, COMBO) versus no alteration (squamous cell carcinoma). P=0.93 Months
H. erbB signaling pathway genes (EGFR mutated or amplified, Braf mutated, Kras mutated, RASSF1A methylated; and p53 mutated, at least one altered, COMBO (+P53)) versus no alteration (squamous cell carcinoma). P=0.09 Months