Download
1 / 40
400 likes | 530 Views
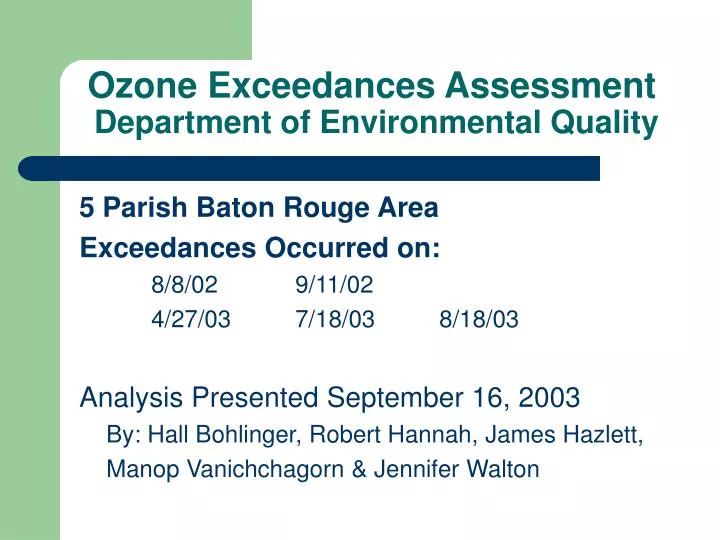
Ozone Exceedances Assessment Department of Environmental Quality. 5 Parish Baton Rouge Area Exceedances Occurred on: 8/8/02 9/11/02 4/27/03 7/18/03 8/18/03 Analysis Presented September 16, 2003 By: Hall Bohlinger, Robert Hannah, James Hazlett, Manop Vanichchagorn & Jennifer Walton.

E N D
Ozone Exceedances Assessment Department of Environmental Quality 5 Parish Baton Rouge Area Exceedances Occurred on: 8/8/02 9/11/02 4/27/03 7/18/03 8/18/03 Analysis Presented September 16, 2003 By: Hall Bohlinger, Robert Hannah, James Hazlett, Manop Vanichchagorn & Jennifer Walton
Agenda • Welcome • Concern over Ozone Exceedances • Ozone Exceedance Assessment • Monitored Data • Back Wind Trajectories • Actual Emissions • Recent Actions • Next Steps
1-hour exceedances occurred at the following monitors in 2002: 1-hour Max, ppb (125 ppb)
1-hour exceedances occurred at the following monitors in 2003: 1-hour Max, ppb (125 ppb)
8-hr Exceedances/Design Values 85 ppb standard
Common Factors During Baton Rouge Ozone Episodes • Recent ozone events occurred on days predicted to be green or low yellow air quality. • On 8/18/03 the cloud cover was predicted to be about 65%. • Afternoon clouds did not arrive, however, and cloud cover was actually closer to 10%. • Ozone events characterized by low wind speed and temperatures in the 90’s. • Ozone events appear to be very localized and not regional in nature. • While the Baton Rouge Capitol Site is dominated by mobile sources 90% of the time, recent ozone events were preceded by spikes of VOCs not characteristic of mobile sources.
Ozone Forecast for 7/18/03 • Measured values are much higher than predicted values for both 1-hr and 8-hr concentrations.
Ozone Forecast for 8/18/03 • Measured values are much higher than predicted values for both 1-hr and 8-hr concentrations.
Improving the Understanding of Ozone Episodes • Rate of ozone formation characterization • Identify VOC species which are the most significant contributors to ozone formation • Improve analysis of monitored VOC variability during & preceding episodes • Back trajectory analysis to locate possible sources • Acquire better understanding of plant-to-plant emissions variability during ozone episodes
How is ozone formed? O + O2 O3 NO2 + hv NO + O NO + O3 NO2 + O2 Reactive VOCs interact with hydroxyl radicals to convert NO to NO2 O3 + hv O2 + O O + H2O 2 OH OH + O2 + RH RO2 + H2O RO2 + NO RO + NO2 RO + O2 HRHO + HO2 HO2 + NO NO2 + OH The outcome of these reactions is the additional NO2 formed photolizes producing more ozone – less NO is available to scavenge the ozone
Rate of Ozone Formation:In the hour preceding exceedances 10-15 ppb/hr = typical > 40 ppb/hr = rapid ozone formation
Capitol Site 7/18/2003 1 hr stnd - 125 ppb 12:00-1:00 = 60 ppb ozone increase
Port Allen Site 7/18/2003 1 hr stnd - 125 ppb 11:00-12:00 = 50 ppb ozone increase 9:00-10:00 = 50 ppb ozone increase
Most Abundant VOC Species Identified at BR Capitol Site(Top 10 Represent 48% of Total VOC) propane n-butane ethane isopentane (2-methylbutane ) ethylene isobutane (2-methylpropane) propylene n-pentane toluene n-hexane Ranked by abundance in ppbc
The incremental reactivity characterizes the ozone formation potential of a VOC specie and all of its reaction products.
VOC Species at BR Capitol SiteRanked by Ozone Forming Potential(Top 10 Represent 95% of Total Reactivity) ethylene propylene isoprene m/p-xylene 1-butene n-butane isopentane (2-methylbutane ) toluene o-xylene isobutane (2-methylpropane) Ranked by abundance in ppbc * MIR Red indicates HRVOC species with recently lowered RQ.
Iberville Ascension East BTR West BTR
VOC Diurnal Profiles Typically VOC concentrations peak during 6-9am period and reach lowest levels during late afternoon hours.
The ozone event on 7/18/2003 was preceded by above normal spikes of VOCs. Capitol Site 3:00 pm exceedance 147ppb
Note the peaks in VOC concentration throughout the ozone exceedance.
The ozone event on 8/18/2003 was also preceded by above normal spikes of VOCs. Capitol Site 2:00 pm exceedance 139 ppb
Analysis of VOC Profiles • The Hydrocarbon Profile (fingerprint) of Capitol Site is usually very consistent and dominated by mobile source emissions, particularly during the morning rush hour (6-9am). • An analysis of peak concentrations observed before & during ozone events has indicated sources of VOC’s other than mobile. • The Capitol site 6-9am sample on 8/17/03 showed impact of source very similar to evaporative gasoline. • A sample collected just 3 hours later shows entirely different source domination in the VOC profile. Profile dominated by very light VOCs including the highly reactive species, ethylene & propylene.
Normal mobile-dominated source profile versus profile of sample containing above normal amounts of HRVOC’s Isobutane Ethylene Propane Propylene
Southern University Site detects frequent hits of industrial emissions. • Continuous VOC monitor triggers canister collection during periods of above normal VOC concentrations. • Sampler has triggered 43 times so far during 2003. • Multiple VOC profiles have been observed. • Total VOC concentrations up to nearly 7 ppm have been observed with hits of MTBE hits up to 400 ppbv. • Concentrations of highly reactive VOCs, ethylene & propylene, commonly observed in the 30 – 60 ppbc range.
The night before the July 18th ozone event, the Southern monitor was triggered by a source contributing ethylene & isobutane. Isobutane Ethylene
The capitol site sample preceding 8/18/03 ozone event & Southern spike sample preceding 7/18/03 ozone event appear to have been impacted by the same source emitting primarily ethylene & isobutane. Isobutane Ethylene
Isobutane Propane Propylene Ethylene
An analysis of the wind direction when ethylene/propylene spikes occur indicates two local sources – one source to the north-northeast of the site and a second source to the northwest of the site.
The south Scotlandville event monitor is triggered less often but indicates a source to the south with another possible source north to northeast of the site.
BTR Ozone History & Progress • In Nov. 1990, BTR was designated as a serious ozone non-attainment area. The attainment date was set for Nov. 1999. • The first Ozone Task Force was formed. • Rate of Progress commitments were made to reduce VOC emissions - 15% by 1994; 9% by 1996 • Despite progress in reducing emissions and the number of exceedance days, BTR failed to meet the Nov. 1999 attainment date. • The second Ozone Task Force convened. • Effective June 23, 2003, the BTR area was bumped up to a severe ozone non-attainment classification.
5 Parish Baton Rouge Area Point Source VOC Emissions Approx tons: 1990 = 39,000 2002 = 13,000 67% Reduction
5 Parish Baton Rouge Area Point Source NOx Emissions Approx tons: 1990 = 66,700 2002 = 42,300 37% Reduction
Consequences of the Exceedances:Continued Non-Attainment • No chance for attainment with the 1 hour standard for 2003 or 2004 • Attainment date is 2005 • Severe non-attainment designation remains • RFG • Offsets – increased to 1.3 to 1 • Redefinition of Major Source – lowered to 25 tpy • Penalty Fees?
Consequences of Continued Non-Attainment & Severe Status: Penalty Fees • CAA Section 185 requires the assessment of penalty fees on facilities in an area designated as severe if the area fails to reach attainment by 2005. • Fees are assessed for each ton of NOx and VOC emissions in excess of 80% of the source’s baseline amount. • Fee is equal to $5000 per ton plus an annual CPI adjustment; predicted to be $7500 per ton. • Based on actual 2002 emissions, annual fees for some local companies will likely equal (in millions): • Dow - $14.8 Shell Chem. - $1.9 PCS - $2 • Exxon Chem. - $6.3 Exxon Ref. - $7.9 Placid - $1.8
Recent Actions • Emergency rule to lower HRVOC RQs • Effective 8/12/03 • 18 of 20 notices received as a result of emergency rule • Administrative Order – 9/3/03 • Maintain and submit HRVOC data by 10/3/03 • Additional monitoring • Speciated VOC event monitors added at Capitol, Port Allen, LSU and Carville • Discussions with EPA on collaborative effort to study BTR’s ozone exceedances
Next Steps • Permanent rule to lower HRVOC RQs • Required speciation of HRVOCs in permits • Ethylene, propylene & butenes • Debate with EPA over Interprecursor Trading • Form Ozone Technical Committee - Convene by October • Evaluate additional data collected (Monitors, RQ’s & AO) • Design studies and determine needed resources by 12/03 • Oversee contracted research projects to begin by 5/1/04 and be complete by 11/04 • Recommend control strategies, if needed • Form Ozone Steering Committee -Convene by October • Secure funding for research
For more information… • James Hazlett • 225-219-3554 • Manop Vanichchagorn • 225-219-3489 • Jennifer Walton • 225-219-3486 • LDEQ Ozone Website • http://www.deq.state.la.us/evaluation/ozone/index.htm