Download
1 / 97
970 likes | 1.1k Views
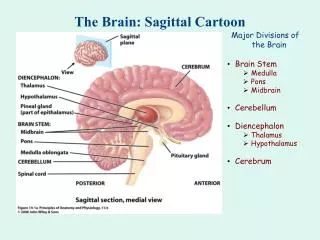
Grid computing: An introduction Lionel Brunie National Institute of Applied Science (INSA) LIRIS Laboratory/DRIM Team – UMR CNRS 5205 Lyon, France http://liris.cnrs.fr/lionel.brunie. A Brain is a Lot of Data! (Mark Ellisman, UCSD). And comparisons must be made among many.

E N D
Grid computing: An introductionLionel BrunieNational Institute of Applied Science (INSA)LIRIS Laboratory/DRIM Team – UMR CNRS 5205Lyon, Francehttp://liris.cnrs.fr/lionel.brunie
A Brain is a Lot of Data!(Mark Ellisman, UCSD) And comparisons must be made among many We need to get to one micron to know location of every cell. We’re just now starting to get to 10 microns
Data Intensive Physical Sciences • High energy & nuclear physics • Simulation • Earth observation, climate modeling • Geophysics, earthquake modeling • Fluids, aerodynamic design • Pollutant dispersal scenarios • Astronomy- Digital sky surveys: modern telescopes produce over 10 Petabytes per year by 2008 ! • Molecular genomics • Chemistry and biochemistry • Financial applications • Medical images
Performance evolution of computer components • Network vs. computer performance • Computer speed doubles every 18 months • Network speed doubles every 9 months • Disk capacity doubles every 12 months • 1986 to 2000 • Computers: x 500 • Networks: x 340,000 • 2001 to 2010 • Computers: x 60 • Networks: x 4000 Moore’s Law vs. storage improvements vs. optical improvements. Graph from Scientific American (Jan-2001) by Cleo Vilett, source Vined Khoslan, Kleiner, Caufield and Perkins.
Hansel and Gretel are lost in the forest of definitions • Distributed system • Parallel system • Cluster computing • Meta-computing • Grid computing • Peer to peer computing • Global computing • Internet computing • Network computing • Cloud computing
Distributed system • N autonomous computers (sites): n administrators, n data/control flows • an interconnection network • User view: one single (virtual) system • «A distributed system is a collection of independent computers that appear to the users of the system as a single computer » Distributed Operating Systems, A. Tanenbaum, Prentice Hall, 1994 • « Traditional » programmer view: client-server
Parallel System • 1 computer, n nodes: one administrator, one scheduler, one power source • memory: it depends • Programmer view: one single machine executing parallel codes. Various programming models (message passing, distributed shared memory, data parallelism…)
CPU Memory CPU CPU CPU Memory Memory Memory Periph. network network network network CPU CPU CPU CPU CPU CPU CPU CPU CPU Memory CPU Memory CPU Interconnection network Examples of parallel system A CC-NUMA architecture A shared nothing architecture
Cluster computing • Use of PCs interconnected by a (high performance) network as a parallel (cheap) machine • Two main approaches • dedicated network (based on a high performance network: Myrinet, SCI, Infiniband, Fiber Channel...) • non-dedicated network (based on a (good) LAN)
Where are we today ? • A source for efficient and up-to-date information: www.top500.org • The 500 best architectures • N° 1: 1,8 (2,3) Pflops ! N° 500: 20 Tflops • Sum (1-500) = 20 Pflops • 1 Flops = 1 floating point operation per second • 1 TeraFlops = 1000 GigaFlops – 1 Pflops = 1000 TeraFlops
How it grows ? • in 1993 (prehistoric times!) • n°1: 59.7 GFlops • n°500: 0.4 Gflops • Sum = 1.17 TFlops • in 2004 (yesterday) • n°1: 70 TFlops (x1118) • n°500: 850 Gflops (x2125) • Sum = 11274 Tflops and 408629 processors
2007/11 best: http://www.top500.org/ Peak: 596 Tflops !!! http://www.top500.org/
2008/11 best: http://www.top500.org/ Peak: 1457 Tflops !!! http://www.top500.org/
2009/11 best: http://www.top500.org/ Peak: 2331 Tflops !!! http://www.top500.org/
NEC earth simulator (1st en 2004 ; 30th in 2007) Single stage crossbar: 2700 km of cables A MIMD with Distributed Memory 700 TB disk space 1.6 PB mass storage Area: 4 tennis courts, 3 floors
BlueGene • 212992 processors – 3D torus • Rmax = 478 Tflops ; Rpeak = 596 Tflops
RoadRunner • 3456 nodes (18 clusters) - 2 stage fat tree Infiniband (optical) • 1 node= 2 AMD Opteron DualCore + 4 IBM PowerXCell 8i • Rmax = 1.1Pflops ; Rpeak = 1.5Pflops • 3,9 MW (0,35 Gflops/W)
Jaguar • 224162 cores – Memory: 300 TB – Disk: 10 PB • AMD x86_64 Opteron Six Core 2600 MHz (10.4 GFlops) • Rmax = 1759 – Rpeak = 2331 • Power: 6,950 MW • http://www.nccs.gov/jaguar/
Network computing • From LAN (cluster) computing to WAN computing • Set of machines distributed over a MAN/WAN that are used to execute parallel loosely coupled codes • Depending on the infrastructure (soft and hard), network computing is derived in Internet computing, P2P, Grid computing, etc.
Visualization Meta computing (beginning 90’s) • Definitions become fuzzy... • A meta computer = set of (widely) distributed (high performance) processing resources that can be associated for processing a parallel not so loosely coupled code • A meta computer = parallel virtual machine over a distributed system SAN LAN Cluster of PCs WAN SAN Supercomputer Cluster of PCs
Internet computing • Use of (idle) computer interconnected by Internet for processing large throughput applications • Ex: SETI@HOME • 5M+ users since launching • 2009/11: 930k users, 2.4M computers; 190k active users, 278k active computers, 2M years of CPU time • 234 « countries » • 1021 floating point operations since 1999 • 769 Tflops! • BOINC infrastructure (Décrypthon, RSA-155…) • Programmer view: a single master, n servants
Global computing • Internet computing on a pool of sites • Meta computing with loosely coupled codes • Grid computing with poor communication facilities • Ex: Condor (invented in the 80’s)
Peer to peer computing • A site is both client and server: servent • Dynamic servent discovery by « contamination » • 2 approaches: • centralized management: Napster, Kazaa, eDonkey… • distributed management: Gnutella, KAD, Freenet, Bittorrent… • Application: file sharing
Grid computing (1) “Coordinated resource sharing and problem solving in dynamic, multi-institutional virtual organisations” (I. Foster)
Grid computing (2) • Information grid • large access to distributed data (the Web) • Data grid • management and processing of very large distributed data sets • Computing grid • meta computer
Parallelism vs grids: some recalls • Grids date back “only” 1996 • Parallelism is older ! (first classification in 1972) • Motivations: • need more computing power (weather forecast, atomic simulation, genomics…) • need more storage capacity (Petabytes and more) • in a word: improve performance ! 3 ways ... Work harder --> Use faster hardware Work smarter --> Optimize algorithms Get help --> Use more computers !
The performance ? Ideally it grows linearly • Speed-up: • if TS is the best time to process a problem sequentially, • then the parallel processing time should be TP=TS/P with P processors • speedup = TS/TP • the speedup is limited by Amdhal law: any parallel program has a purely sequential and a parallelizable part TS= F + T//, • thus the speedup is limited: S = (F + T//) / (F + (T///P)) < P • Scale-up: • if TPS is the time to solve a problem of size S with P processors, • then TPS should also be the time to process a problem of size n*S with n*P processors
Starting point • Real need for very high performance infrastructures • Basic idea: share computing resources • “The sharing that the GRID is concerned with is not primarily file exchange but rather direct access to computers, software, data, and other resources, as is required by a range of collaborative problem-solving and resource-brokering strategies emerging in industry, science, and engineering” (I. Foster)
Applications • Distributed supercomputing • High throughput computing • On demand (real time) computing • Data intensive computing • Collaborative computing
An Example Virtual Organization: CERN’s Large Hadron ColliderWorldwide LHC Computing Grid (WLCG) 8000 Physicists, 170 Sites, 34 Countries 15 PB of data per year; 100,000 CPUs
Why Grid Computing (CERN opinion) ? • The answer is "money"... In 1999, the "LHC Computing Grid" was merely a concept on the drawing board for a computing system to store, process and analyse data produced from the Large Hadron Collider at CERN. However when work began on the design of the computing system for LHC data analysis, it rapidly became clear that the required computing power was far beyond the funding capacity available at CERN. • On the other hand, most of the laboratories and universities collaborating on the LHC had access to national or regional computing facilities. • The obvious question was: Could these facilities be somehow integrated to provide a single LHC computing service? The rapid evolution of wide area networking—increasing capacity and bandwidth coupled with falling costs—made it look possible. From there, the path to the LHC Computing Grid was set.
Why Grid Computing (CERN opinion) ?Additional benefits • Multiple copies of data can be kept in different sites, ensuring access for all scientists involved, independent of geographical location. • Allows optimum use of spare capacity for multiple computer centres, making it more efficient. • Having computer centres in multiple time zones eases round-the-clock monitoring and the availability of expert support. • No single points of failure. • The cost of maintenance and upgrades is distributed, since individual institutes fund local computing resources and retain responsibility for these, while still contributing to the global goal. • Independently managed resources have encouraged novel approaches to computing and analysis. • So-called “brain drain”, where researchers are forced to leave their country to access resources, is reduced when resources are available from their desktop. • The system can be easily reconfigured to face new challenges, making it able to dynamically evolve throughout the life of the LHC, growing in capacity to meet the rising demands as more data is collected each year. • Provides considerable flexibility in deciding how and where to provide future computing resources. • Allows community to take advantage of new technologies that may appear and that offer improved usability, cost effectiveness or energy efficiency.
LCG System Architecture • A 4 layers Computing Model • Tier-0: CERN: accelerator • Data Acquisition and Reconstruction • Data Distribution to Tier-1 (~online) • Tier-1 • 24x7 Access and Availability, • Quasi-online data Acquisition • Data Service on the Grid • “Heavy” Analysis of the data • ~10 countries • Tier-2 • Simulation • Final User, Analysis of the data (batch and interactive modes) • ~40 Countries • Tier-3 • Final User, Scientific analysis Tier-0 (1) Tier-1 (11) Tier-2 (160) « Tier-3 » End User • LHC • 40 millions collisions per second • ~100 interesting collisions per second after filtering • 1-10 MB of data per collision • Acquisition rate: 0.1 to 1 GB/sec • 1010 collisions recorded every year • ~10 PBytes/year
LCG System Architecture (Cont’d) Tier-0 Trigger and Data Acquisition System 10 Gbps links Optical Private Network (to almost all sites) Tier-1 General Purpose/Academic/Research Network Tier-2 From F. Malek – LCG France
Back to roots (routes) • Railways, telephone, electricity, roads, bank system • Complexity, standards, distribution, integration (large/small) • Impact on the society: how US grown • Important differences: • clients (the citizens) are NOT providers (states or companies) • small number of actors/providers • small number of applications • strong supervision/control
Computational grid • “Hardware and software infrastructure that provides dependable, consistent, pervasive and inexpensive access to high-end computational capabilities” (I. Foster) • Performance criteria: • security • reliability • computing power • latency • throughput • scalability • services
Grid characteristics • Large scale • Heterogeneity • Multiple administration domain • Autonomy… and coordination • Dynamicity • Flexibility • Extensibility • Security
Levels of cooperation in a computing grid • End system (computer, disk, sensor…) • multithreading, local I/O • Cluster • synchronous communications, DSM, parallel I/O • parallel processing • Intranet/Organization • heterogeneity, distributed admin, distributed FS and databases • load balancing • access control • Internet/Grid • global supervision • brokers, negotiation, cooperation…
Basic services • Authentication/Authorization/Traceability • Activity control (monitoring) • Resource discovery • Resource brokering • Scheduling • Job submission, data access/migration and execution • Accounting
Application Application Internet Protocol Architecture “Coordinating multiple resources”: ubiquitous infrastructure services, app-specific distributed services Collective “Sharing single resources”: negotiating access, controlling use Resource “Talking to things”: communication (Internet protocols) & security Connectivity Transport Internet “Controlling things locally”: Access to, & control of, resources Fabric Link Layered Grid Architecture(By Analogy to Internet Architecture) From I. Foster
Resources • Description • Advertising • Cataloging • Matching • Claiming • Reserving • Checkpointing
Resource management (1) • Services and protocols depend on the infrastructure • Some parameters • stability of the infrastructure (same set of resources or not) • freshness of the resource availability information • reservation facilities • multiple resource or single resource brokering • Example of request: I need from 10 to 100 CE each with at least 512 MB RAM and a computing power of 150 Mflops