Download
1 / 18
180 likes | 344 Views
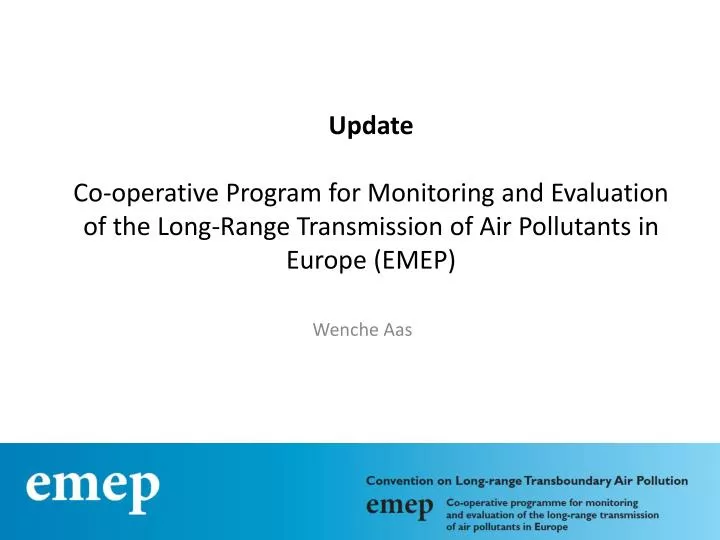
Update Co-operative Program for Monitoring and Evaluation of the Long-Range Transmission of Air Pollutants in Europe (EMEP) . Wenche Aas. UN-ECE C onvention on L ong- R ange T ransboundary A ir P ollution ( 52 Parties ) - 8 Specific protocols , where the first is

E N D
UpdateCo-operative Program for Monitoring and Evaluation of the Long-Range Transmission of Air Pollutants in Europe (EMEP) Wenche Aas
UN-ECEConvention on Long-Range TransboundaryAir Pollution (52 Parties) - 8 Specificprotocols, wherethe first is European Monitoring and Evaluation Programme (EMEP) (42 Parties) The EMEP vision; To be themainsciencebased and policy-driven instrument for internationalcooperation in atmosphericmonitoring and modellingactivities, emissioninventories and projections, and integratedassessmentto helpsolve transboundary air pollution problems in Europe
Critical load exceedanceof nutrient nitrogen Eq ha-1 yr-1 • Areas at risk • = 63% • 2010 = 52% • 2020 = 37% 1990 2000 ? 2005 2010 2020 revised GP
EMEP/CCC-update, • ”EMEP ObservationsBooklet” finalized fall 2012. • EMEP Intensive monitoringcampaigns • Recentlycompleted, 21 Parties, 31 sitesparticipated • Min dust, EC/OC, ACSM, lots of data, interpretationremains: Xavier! • EBAS update • Meta data representationimproved • Additional data (ACTRIS, GUAN, ++) (Aerosol, VOCs..) • EBAS-HTAP • Update for HTAP anticipated, GEO data infrastructure • EANET • GAW (RG-SAG, WDCA, WDCGG_NODE) • UNEP GMP (Stockholm Convention), oneoftwo data centers • AMAP, ARCTIC Council, SAON, SLCP… • AQUILA, AirMonTech (Research Roadmap) • ESFRI Roadmap… (ACTRIS) • Methodologies, website, training… • Bilateral dialoguewithPartieswrtmonitoringobligations, data reporting, QAQC etc.
http://www.atmos-chem-phys.net/12/5447/2012/acp-12-5447-2012.htmlhttp://www.atmos-chem-phys.net/12/5447/2012/acp-12-5447-2012.html
Monitoring programme: • Level 1 • Main ions in precipitation and in air • heavy metals in precipitations • ozone • gas particle nitrogen ratios (low cost) • PM10 and PM2.5 mass • meteorology • at ca 125 sites • Level 2, supersite (joint EMEP/GAW) • PM composition (EC/OC, mineral dust) • Aerosol physical and optical properties • CH4 • Tracers (CO and halocarbons) • POPs • Heavy metals in air and aerosols • VOC • + all level 1 activities • 20-30 sites Both levels are mandatory by all Parties
Sulphur • Results from the EMEP monitoring show 70-90% reductions in ambient concentrations and deposition of sulphur species since 1980. • As a result of the large reductions in sulphur concentrations, the acidity of precipitation has decreased across Europe. • Despite these significant reductions, sulphate still remains one of the single most important compounds contributing to regional scale aerosol mass concentration.
Trends in sulphur in Europe Ref: Tørseth et al, ACP, 2012
Nitrogen Also reduction in emissions of nitrogen oxides (NOX) are reflected in the measurements, with an average decrease of nitrogen dioxide in air and nitrate in precipitation by about 23% and 25% respectively since 1990. Only minor reductions are however seen since the late 1990s. The concentration of total nitrate in air have decreased on average only by 8% since 1990, and few sites show a significant trend. A majority of the EMEP sites show a decreasing trend in reduced nitrogen both in air and precipitation on the order of 25% since 1990.
EU Infrastructure in support to EMEP and WMO/GAW • EMEP : www.emep.int • ICOS: http://www.icos-infrastructure.eu/ • Integrated Carbon Observation System • InGOS: http://www.ingos-infrastructure.eu • Integrated non-CO2 greenhouse gas observing system (halocarbons, N2O, CH4, SF6, H2) • ACTRIS: www.actris.net • Aerosols, Clouds, and Trace gases Research InfraStructure Network • SIOS:http://www.sios-svalbard.org/ • Svalbard Integrated Arctic Earth Observing System European Strategy Forum on Research Infrastructures (ESFRI).
Indicator for implimentationofmonitoringstrategy • Numberofsiteswith data reported • Numberof variables reported • Numberof variables havingadequate time resolution • Major inorganics in precipitation (10 variables) • Major inorganics in air (13 variables) • Ozone (1 variable) • PM mass (2 variables) • Heavy metals in precipitation (7 variables) Compare «actual» numberof variables reportedwith «expected»
Example Norway 2005: Expected: 8 sites * # variables expected = 80 datasetsofprecipitationchemistry Reported: 60, howeveronly 50 meetrequirementswrt time resolution These 10 datasetsare given 50% weight: 50 + 10/2 = 55% «implementation» = 55/80 = 69%
69 Comment: IF implementation > 100%: plot max 120%
First version of PC SAG data in ebas, to be deleted. Been some confusion (at NILU) which dataset belongs to HTAP and to the old PCSAG dataset