Download
1 / 27
270 likes | 403 Views
Estimates of worst 20% natural condition deciview: application of the new IMPROVE algorithm and a revised statistical approach. Rodger Ames, CIRA (rames@cira.colostate.edu) Marc Pitchford DRI, NOAA RPO Monitoring and Data Analysis Call April 26, 2006. Reasons to revise.

E N D
Estimates of worst 20% natural condition deciview: application of the new IMPROVE algorithm and a revised statistical approach Rodger Ames, CIRA (rames@cira.colostate.edu) Marc Pitchford DRI, NOAA RPO Monitoring and Data Analysis Call April 26, 2006
Reasons to revise • new IMPROVE algorithm (NIA) • new OC mass conversion factor, mass scattering efficiencies, etc. • more monitoring site provide better spatially resolved statistical parameters • 55 sites available for 1996-2000 analysis, 141 for 2000-20041 • old method based on simplistic east/west division of frequency distribution standard deviation. In new approach every site has statistical underpinning • revised statistical approach uses new insights • Gaussian dv frequency distribution assumption can be improved upon • 1. Five urban sites were not used for 2000-2004 statistical analysis. Results for four AK sites, two Hawaii sites, and VIIS are not presented here. Two sites failed RHR criteria for baseline period.
Steps • Estimate aerosol light extinction (aerosolbext) and deciview (dv) frequency distribution parameters by simulating natural conditions from current data. • Determine appropriate statistical approach to convert natural condition mean aerosol mass concentrations to worst 20% natural condition dv. • Simulate worst 20% natural condition dv using key frequency distribution parameters obtained from 2000-2004 IMPROVE data.
Step 1: simulate natural conditions scenario from current data • roll back current sulfate and nitrate aerosol mass concentrations to natural levels • assume nitrates and sulfates are predominately anthropogenic in origin, while carbon and crustal species are predominately natural origins • for each IMPROVE site (n obs > 300, 129 sites) during 2000-2004, daily nitrate and sulfate concentrations are scaled so that the 5-year mean equals the estimated annual average natural sulfate and nitrate levels for the east and west U.S.1
Step 1: natural condition aerosol mass concentrations, east/west U.S. Table 1. Estimated particle mass concentrations (mg/m3) for the east and west U.S. under natural conditions1 1. Trijonis J.C.; Malm W.C.; Pitchford M.; White W.H., Chapter 24 of Acidic Deposition: State of Science and Technology, vol. 3 Terrestrial, Materials, Health and Visibility Effects, edited by P. M. Irving, U.S. Natl. Acid Precip. Assess. Prog. (NAPAP)., Washington D.C., 1990. East is defined as “basically up to one tier of states west of the Mississippi” and west as “basically the desert/mountain areas of the Mountain and Pacific time zones”1 Table 2. modifications to natural conditions mass and key differences in new IMPROVE algorithm in revised approach
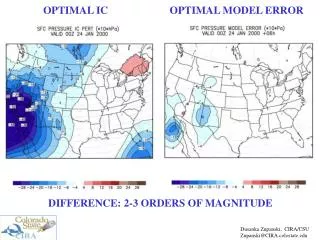
Step1: roll back current sulfate and nitrate aerosol mass concentrations to natural levels Current and natural condition scenario daily dv frequency distribution standard deviation using new IMPROVE algorithm and 2000-2004 data. Figure 1. current dv standard deviation. Figure 2. dv standard deviation for natural condition scenario.
Step1: natural condition scenario and recap of old default approach • natural condition scenario dv standard deviation (s) is between 3-4 for most of the continental U.S. IMPROVE sites, with a region of lower dv s between 2-3 along the Colorado Plateau • regions of higher dv s, between 4-5, along the CA Sierra and Northern Rockies. Other localized areas with dv s in the 4-5 range occur, for example in FL at Everglades and sites in the southwest and mountain regions • old approach assumed east and west U.S. dv standard deviations of 3 and 2, respectively to conform to east/west mass concentrations. Also assumed Gaussian dv frequency distribution (FD) to estimate distribution tails from FD standard deviation and mean
Step 2: revise statistical approach - dv frequency distributions Examine natural condition scenario FD shape parameters. Natural condition scenario dv FDs all have positive skew and kurtosis. Figure 1. FD kurtosis vs. skewness Figure 2. map of FD skewness Skew greater than 0 indicates the distribution is skewed to the right, or towards higher values. A normal distribution has a skewness of 0. Positive kurtosis indicates distributions with large tails. As presented, a normal distribution will have kurtosis of zero.
Step 2: revise statistical approach - log(aerosolbext) frequency distributions Natural condition scenario log(aerosolbext) frequency distribution skewness and kurtosis. Figure 1. FD kurtosis vs. skewness Figure 2. map of FD skewness Skew is symmetric about zero and has less magnitude than in dv FDs. Some outliers exist, possibly due to a few outlying datapoints.
Step 2: revise statistical approach - log(aerosolbext) frequency distributions Natural condition scenario log(aerosolbext) frequency distribution mean and standard deviation Figure 2. map of FD mean Figure 1. FD standard deviation vs. mean Figure 3. map of FD standard deviation
Step 3: Simulate worst 20% natural condition deciview using frequency distribution parameters • generate random Gaussian (n=500) frequency distributions to simulate natural log(aerosolbext) FD. • use natural condition aerosol mass (east/west), site specific fRHs, site or regionally specific FD standard deviations. • add site specific rayleigh to each (daily) simulated abext FD value • calculate daily simulated worst 20% dv • FD(dv,nc)=10*ln(FD(FDbext/10) • calculate mean of worst 20% dv • P80 = floor(.8*n)+1 • G90= mean(FD(dv,nc(p80…n))
Step 3: natural condition scenario log(abext) frequency distribution standard deviation Figure 1. 2000-2004 log aerosol bext natural condition scenario frequency distribution standard deviation, same as previous figure but scaled to observed range.
Step 3: natural condition scenario log(abext) frequency distribution standard deviation Natural condition scenario log(aerosolbext) frequency distribution standard deviation at 3 and 2 step values. Use site specific log(aerosolbext) standard deviation for NC simulations.
Recap: old default method, mean of worst 20% natural condition dv Figure 1. Ames and Malm (2001, Bend OR, AWMA conference proceeding). Modified to better estimate worst 20% mean from normal distribution parameters (92 percentile rather than 90th).
Recap: old default method, mean of worst 20% natural condition dv Figure 1. Ames and Malm (2001 Bend OR, AWMA conference proceeding). Modified to better estimate worst 20% mean from normal distribution parameters (92 percentile rather than 90th).
Step 3: new approach, mean of worst 20% natural condition dv Figure 1. Use NIA, site specific rayleigh, site specific standard deviation, Rand500 to generate normal NC dv FD. Units are dv. Rand500 overestimating FD s by ~3%.
Step 3: new statistical approach vs. old default method, natural condition mean of worst 20% dv Regions in darker blue indicate ~< 10% change old default estimates. Positive values indicate higher values from the new approach. Figure 1. Fraction which the new NC G90 differs from the old approach (expressed as new/old-1)
Recap: glide slopes from current 2000-2004 conditions to default natural conditions Figure 1. Glide slopes from the old default approach. Uses old IMPROVE algorithm for baseline and natural condition values. Units are dv/10 years.
Step 3: glide slopes using new statistical approach Regions in dark blue indicate current conditions are close to natural condition estimates, or glide slope ~ zero. Figure 1. Glide slopes from the new approach. Uses new IMPROVE algorithm for baseline and natural condition values. Units are dv/10 years.
Step 3: new statistical approach vs. old default method, glide slope comparison. Regions in red indicate little modification to glide slope using new approach. Negative values indicate decrease in glide slope magnitude for new approach. Figure 1. Fraction which the new glide slope differs from the old approach (expressed as new/old-1)
Conclusions • little change in NC estimates from NIA alone. • log (aerosolbext) better approximates Gaussian distribution than dv. • new approach worst 20% dv higher by 30-80% than old default approach along mountains of CA, northwest, and northern U.S. Rockies. • new glide slopes close to zero in some western regions, suggesting current worst day conditions are near natural estimates. • using FD parameters derived from 2000-2004 data in natural condition estimates makes sense because the baseline data contain similar FD characteristics. That is, sites with higher baseline dv (due to fire or dust) should get higher natural conditions value. But do they?
Future work Sensitivity analysis • Gaussian FD assumption is a better approximation for log transformed aerosolbext metric however, some deviations occur • sensitivity to changes in natural condition mass concentrations • sensitivity to changes in skew, kurtosis parameters • examine sites with large magnitude FD skew, kurtosis - what is driving negative skew at some sites? Refinements to new natural condition estimation approach • incorporate observed dist skew, kurtosis, and other distribution parameters • incorporate longer time period into NC scenario – better averaging for fires, etc… • how much can we rely on model data from 2000-2004 period for NC estimates? (fire emissions in WRAP Plan02b, GEOS-Chem output) Species specific worst 20% natural condition estimates • decompose aerosolbext FD into component species • species GP = (species base line abext- species NC abext)/60 yrs
2000-2004 log(abext) FD mean and standard deviation under natural condition scenario
Recap: mean of worst 20% natural condition dv using old method and new IMPROVE algorithm Figure 1. New IMPROVE algorithm used in default approach. Rayleigh = 10
Step 3: new statistical approach natural condition mean of worst 20% dv Figure 1. Uses NIA, site rayleigh, Rand10K to generate NC dv FD. Units are dv.
2000-2004 worst 20% dv baseline Figure 1. Current conditions baseline for 2000-2004 worst 20% dv. Units are dv.