Download
1 / 55
550 likes | 677 Views
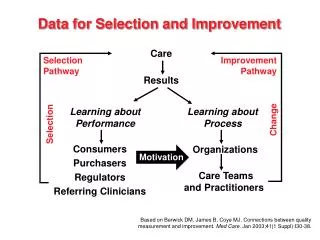
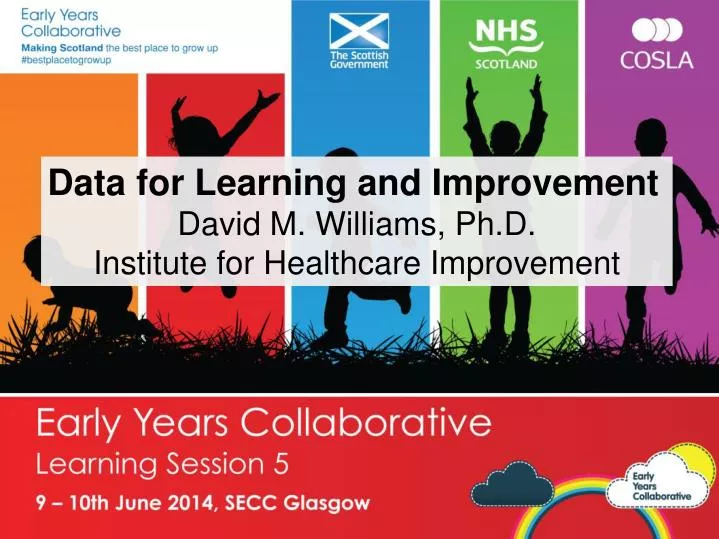
Data for Learning and Improvement David M. Williams, Ph.D. Institute for Healthcare Improvement. Murder rate down compared to this time last year. Celebration. Despair. Three Considerations . Data Definition Date Collection Data Display. Data Definition. % child receiving assessments.

E N D
Data for Learning and Improvement David M. Williams, Ph.D. Institute for Healthcare Improvement
Three Considerations • Data Definition • Date Collection • Data Display
% child receiving assessments % of mom’s receiving pre-natal vitamins Wait times % children in one clinic receiving assessment # of books read % of meals with veg % Team members rate promise level Number of double smiles PDSAs per week % parents rating 7 or greater for confidence # of huddles per week % of Mom’s screened for unhealthy habits
Data Definition • How will you know a change is an improvement?
Count • Count = • Percentage = • Rate = Count Total 100 Count Total Pop 100,000 population
Elements of a Run Chart The centerline (CL) on a Run Chart is the Median ~ X (CL) Measure 2/16/11 3/16 4/13 5/11 6/8 Week Time IG p.435
% antenatal bookers eligible for Healthy Start in Leith (self report) (n=410; source Maternity Trak) “Shift” on run chart (6+ points above median) Annotated Universal enquiry re HS Complete form at booking appt Team meeting Focus on Trak docu-mentation Monthly data release Monthly data release Leith Survey Monkey Team meeting and survey results Median Leith Pioneer site work started 3 March
Case 1 Change
Case 4 Change
Case 5 Change