Download
1 / 35
350 likes | 464 Views
Presenting Evidence to Justify Data Exclusion as an Exceptional Event Ideas based on how EPA has recently documented events to support regulatory decisions. Neil Frank USEPA /OAQPS / AQAD For Presentation at WESTAR State/EPA Exceptional Events Implementation Meeting February 25-26, 2009.

E N D
Presenting Evidence to Justify Data Exclusion as an Exceptional EventIdeas based onhow EPA has recently documented events to support regulatory decisions Neil Frank USEPA /OAQPS / AQAD For Presentation at WESTAR State/EPA Exceptional Events Implementation Meeting February 25-26, 2009
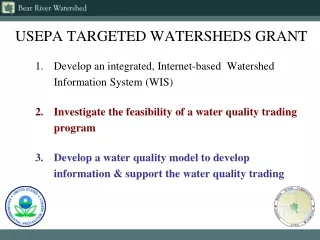
Recent EPA Actions and Support • San Joaquin Valley • PM10 attainment reaffirmation. • http://www.epa.gov/region09/air/sjvalleypm/ • PM2.5 Designations • To document technical basis for final decisions • http://www.epa.gov/pmdesignations/2006standards/state.htm • DataFed (Washington University) • To provide general tools to assist event analysis • http://wiki.esipfed.org/index.php/Evidence_for_Flagging_Exceptional_Events
Exceptional EventsWhat the Rule Says • Eligible Data • Data showing exceedances or violations • Rule Requirements • Event satisfies the definition of exceptional • There is a clear causal relationship • Event is associated with measured concentration in excess of normal fluctuations including background • No exceedance or violation but for the event • Demonstration to justify data exclusion • Any reliable and accurate data
The Required EE Evidencederived from the preamble • In general, the type, amount, and detail level for presentation of evidence will vary by the circumstances for each event. • The more extreme the measured event day concentration, the less evidence would generally be needed to justify that the concentration was exceptional. • Exceptional event data claims that are near average concentration levels will require very detailed documentation. • When concentrations are frequently greater than the level of the NAAQS and they are affected by a diverse set of emission sources, more detailed documentation is likely required.
Types of Data to Considerfor EE evidence, as discussed in preamble • Event characteristics: type, size, location, duration, estimated emissions, press accounts, response agency records, photos, videos, etc. • Comparisons to the concentration history at that monitor. • Comparisons to nearby monitors. • Diurnal patterns of concentrations, if available. • PM2.5 composition data, if available. • Satellite data products and related models. • Weather data. • Wind direction and speed. • Weather maps. • Trajectories (HYSPLIT or other). • Wind roses and pollution roses. • Statistical models relating air pollutant to weather.
Organization of the Demonstration • Make it easy for EPA and the public to review the evidence! • Suggested Contents • General check list of the information provided • Summary of the evidence and • Detailed analysis and data which explains the evidence and justifies the conclusions • Organized in accordance with the four required elements of the exceptional events rule. • The informational items that are mentioned in this briefing include a non-exhaustive listing of those that one might typically expect to see in a technical support analysis
Visualization of How to Organize the EE Demonstration e.g. This document demonstrates a clear causal connection between the XXX event and the measured exceedance of the NAAQS using evidence based on wind trajectories, speciation data and comparison to the historical 95th percentile during the spring. But-for the event, the measured concentration is estimated to have been between XX and YY ug/m3 Check List § 319 definition Summary of Evidence Clear causal connection Comparison to Historical Levels “But-for” the event Detailed Analysis
Example check list of included evidence • Date(s) of the event caused exceedance or violation, by monitor • Monitor location – AQS site id, address, city, county, state • Brief description of event, including news clippings, media coverage. • Site specific event day evidence • Measured FRM concentration • Speciation data • Current season and historical values. • Diurnal profile – event day vs typical high day during same season • Satellite images - HMS fire pixels, AOD, OMI • Air trajectories between suspected source region and event receptor • Nearby site and adjacent State data for comparisons, relative to the general air trajectories.
Suggested Template with examples Detailed Discussion of the Evidence(A)Does it meet the §319 definition? (A)Event Description • Newspaper or media report of the event • Map showing location of monitor site and suspected source area • Discuss controllability, if natural and/or recurring event • Met records when needed Monitors http://www.epa.gov/airexplorer/monitor_kml.htm
Detailed Discussion of the Evidence(B)Was there a causal connection between the event and air quality? Did the event affect ambient concentrations? (without regard to magnitude at this point of the analysis) • Satellite imagery – potential evidence of broad smoke or dust impacts • NOAA HMS fire pixels, AOD , NO2 and Aerosol Index from OMI • See Exceptional Event Console • Determine (a) whether plume crosses monitor locations, and (b) whether elevated PM2.5 readings are observed at these monitors. • Back trajectory analyses from location of monitor (e.g. using CATT or HYSPLIT back trajectory tools) • Extend back 24-48 hours. • Ideally use varying release heights, say of 100, 500 and 1000 meters for air parcels, and at different starting periods for the day. • Do back trajectories intersect with location of fire or other source of emissions? • Trajectories that do not travel from the source to receptor can be viewed as contrary evidence. Different heights may yield different results and may be needed. • Forward trajectories from suspected source region to monitor(s)
Spatial Pattern of High Concentrations AirNow PM2.5 FRM PM2.5 May 24, 2007 http://www.datafed.net/consoles/user_consoles.asp?view_states=ARC/FRMPM25_Day_map,ARC/AIRNOW_PM25_map,ARC/NOAA_HMS_FirePix_map,ARC/OMI_AI_map,ARC/MODIS_AOT_map,ARC/MODIS_Terra_RGB_OnEarthJPL_map,ARC/MODIS_Aqua_RGB_OnEarthJPL_map,ARC/OMI_NO2Trop_map,ARC/CATT_FRMPM25_Traj_map,ARC/VIEWS_SO4_map,ARC/VIEWS_OCfCombined_map,ARC/NAAPS_NoAm_Sulf_map,ARC/NAAPS_NoAm_Smok_map,ARC/FRMPM25_30DayMedian_map,ARC/FRMPM25_diff_map&datetime=2007-05-24T18:00:00&Title=070524_GA_Smoke Analyst's Console.
Satellite Images to Support Smoke impacts from SE GA Fire May 24, 2007 • From “Evidence for Flagging Exceptional Events” • http://wiki.esipfed.org/index.php/Evidence_for_Flagging_Exceptional_Events • Analyst's Console.
To Describe Causal Connection (Transport)Source and Receptor Area Tools At Receptor From Source The user can move the rectangles May 24, 2007c http://webapps.datafed.net/datafed.aspx?page=0705GAFire/CATT_AQS_D http://webapps.datafed.net/datafed.aspx?page=0705GAFire/CATT_AQS_D_Rec
Trajectories should consider different elevations and several potential source regions (starting points) for the dust From: Final Affirmation of Determination of Attainment for the San Joaquin Valley Nonattainment Area http://www.epa.gov/region09/air/sjvalleypm/
Detailed Discussion of the Evidence[B]Was there a causal connection between the event and air quality? (continued) • For smoke impact, evidence of high carbon concentrations, relative to typical and extreme historical levels. • using speciation data, if available • high OC, high OCMmb, high OC/EC ratio • high K+ and non-soil potassium • with NAAPS model to show evidence of smoke (Note: this is not necessarily evidence of ground level impact) • for some event assessments, chemical analysis of the FRM Teflon filter may be needed. • Estimated OC on days without STN measurements. Developed from an equation using NAAPS and days with STN data. • Lack of contrary evidence, such as high sulfates* • For local event, was the concentration higher than surrounding monitors? For regional event, were ambient concentrations consistently high? • Show PM2.5 mass measured at nearby monitors on that day • Display in map form if possible • For claimed fireworks impact, high concentrations of fireworks markers (Sr, K, Cu, Ba, etc) • For dust, evidence of unusual crustal and other coarse PM. *Such information is important to included when available.Partial submittals can be misleading!
Sulfate Carbon Naval Aerosol Analysis and Prediction System (NAAPS) May 24, 2007 Analyst's Console.
Detailed Discussion of the Evidence (C) Was the concentration higher than typical air quality, including background? How unusual was the air quality concentration (and its chemical constituents) • time series or trend plots • permitting comparison of specific day with other days in current and previous years. Generally, this comparison should focus on the same calendar month or a 30 day window surrounding the event day. • PM2.5 mass and chemical constituents could be compared to the historical concentration frequency distribution, to judge against 84th and 95th percentiles.
Comparison to Historical PM10 Concentrations – San Joaquin Examples From: Final Affirmation of Determination of Attainment for the San Joaquin Valley Nonattainment Area http://www.epa.gov/region09/air/sjvalleypm/
Detailed Discussion of the Evidence (C) Was the concentration higher than typical air quality, including background? (continued) • Spatial patterns • To further describe the impact of the event • Look at the increment above the 50th, 84th and 95th percentiles spatially. • See http://wiki.esipfed.org/index.php/Help:Using_the_Concentration_Anomaly_Tool
To Compare with Historical DataConcentration Anomaly Tool Historical 84th percentile for 30 day period Daily Increment May 24, 2007 http://wiki.esipfed.org/index.php/Help:Using_the_Concentration_Anomaly_Tool
Higher hrly values 99th % ile 75th % ile Detailed Discussion of the Evidence (C) Was the concentration higher than typical air quality, including background? (continued) • Hourly data (when available) • is the diurnal profile unusual and consistent with the claimed event, e.g. afternoon transport of dust or evening fireworks Hourly TEOM data, Corcoran (Oct 1, 2006-July 31,2007): Concentrations typically peak in late afternoon Oct 25, 2006 and July 4, 2007 have different pattern Hourly TEOM data, Bakersfield Concentrations typically peak in early evening Oct 25, 2006 and July 4, 2007 have different pattern July 4 Typical distribution July 4 Oct 25 Oct 25
Detailed Discussion of the Evidence (C) Was the concentration higher than typical air quality, including background? (continued) • PM Composition specifics • For summer time events in eastern US, how does the sulfate and carbon concentrations compare to seasonal average levels? • How much of the high claimed event-day concentration is due to other reasons, e.g. regional sulfates? This can provide contrary evidence
Comparison to “Normals” (average, 95th and 99th %iles) (Eastern Hypothetical Example, event day values = *) Example 1 * Event day value for mass or chemical component * 99th %ile Concentration, ug/m3 95th %ile * Seasonal avg. * Event day would not be as “exceptional” if the sulfate concentration was 20 ug/m3, carbon was 15 ug/m3 and there was some nitrate! We will come back to this for the “But-For”
Comparison to “Normals” (average, 95th and 99th %iles) (Western Hypothetical Examples, event day values = *) Example 3 Example 2 * * * * * * * *
Detailed Discussion of the Evidence(D)“But-For” Would the exceedance or violation not have occurred, “but-for” the event? • Comparison of measured PM2.5 mass, and chemical constituents (if available), to seasonal average and seasonal extremes. • Simple estimate of the “but-for” PM2.5 concentration • typical values: 18-30 ug/m3 • Include high values to account for day-to-day variability
Detailed Discussion of the Evidence“But-For” Continued • Better: Utilize chemical constituents associated with the event. For smoke events, use carbon mass. • Estimated event day excess: • OCM minus seasonal average (36-9=27) • OCM minus extreme values, e.g. 95th percentile (36-13=23) • “But-For”: • 45 minus {23-27} ~18-22 ug/m3 • In the above example, the evidence is strong based on the large amount of excess carbon. From Example1 • * An alternative is to look at measured OC and assume excess is all fire-related with mass multiplier of 2. • See http://www.epa.gov/pmdesignations/2006standards/rec/region4R.htm
Detailed Discussion of the Evidence“But-For” Continued • For short duration events, like fireworks (or dust), use hourly data to estimate excess PM. The typical high values can be estimated, e.g. by the historical 95th percentile of hourly values for the same time of the year
Detailed Discussion of the Evidence(E)Public Comments • With the submission of the demonstration, the State must document that the public comment process was followed. Accordingly, the documentation must include the public announcement, description of the public forum in which events were received and the specific public comments, if any.
Appendix New On Line Tools
New On-Line Toolsto assist with assembly of evidenceProducts of Rudy Husar, Washington University • Graphics and access to relevant EE data sets • Trajectories, satellite images, spatial and temporal air quality displays, etc. • On-line tools are expected to remain operational as part of “DATAFED.NET” and ESIP (Federation Of Earth Science Information Partners) • In particular, see: • Evidence for Flagging Exceptional Events • http://wiki.esipfed.org/index.php/Evidence_for_Flagging_Exceptional_Events • Analyst's Console. • EE Community Work Space • http://wiki.esipfed.org/index.php/Exceptional_Air_Pollution_Event_Analysis_Community_Workspace
Catalog of Federated DatasetsAir Quality, Emissions, Meteorology
- THE ANALYST’S CONSOLE Analyst's Console.
Data Views Catalog: • CATT_FRMPM25_Traj • FRMPM25_diff • FRMPM25_30DayMedian • FRMPM25_Day • AIRNOW_PM25 • CATT_FRMPM25 • VIEWS SO4 • VIEWS_OCfCombined • MODIS_Aqua_RGB_OnEarthJPL • MODIS_Terra_RGB_OnEarthJPL • MODIS_AOT • OMI_AI • OMI_NO2Trop • MOPITT_CO • NAAPS_NoAm_AOT • NAAPS_NoAm_Sulf • NAAPS_NoAm_Dust • NAAPS_NoAm_Smok • NOAA_HMS_FirePix