Download
1 / 8
80 likes | 132 Views
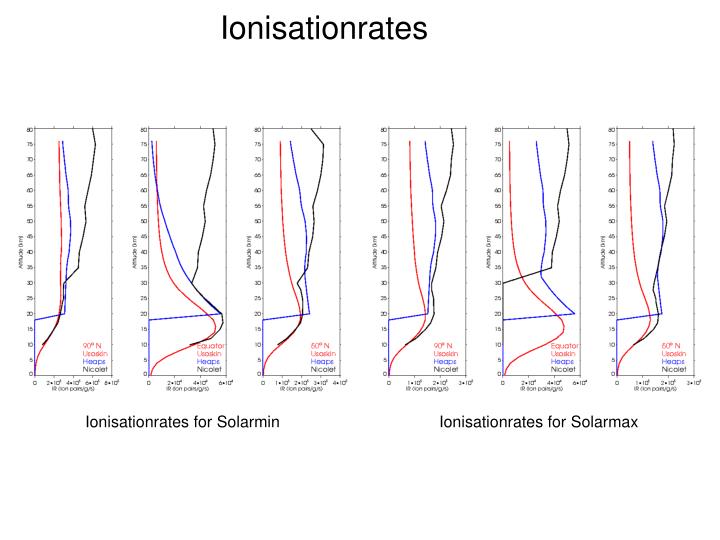
Ionisationrates. Ionisationrates for Solarmin. Ionisationrates for Solarmax. ClOx, ClO, HCl and ClONO2 @50hPa 70-90°. Ozone and NOy @50hPa for 70-90°. NOx and HOx for 70-90°. Cl2O2, Cl2 and PSCs @50hPa for 70-90°. Temperature for 70-90°. NOx, HOx, Ozone and Temperature.

E N D
Ionisationrates Ionisationrates for Solarmin Ionisationrates for Solarmax
NOx, HOx, Ozone and Temperature The plots show the difference between perturbed run and reference run from 1976 to 2002. The first two years were neglected to avoid spin up problems. Hatched areas show 95% significance.
NOy and HNO3 • The upper panel shows the monthly mean for 1978 to 2002 for NOy • Clearly visible the NOy decrease during SH winter. • The explanation is visible in the lower panel which shows monthly mean HNO3 for 1978 to 2002. • The denitrification is responsible for the decrease of NOy.
