Download
1 / 17
180 likes | 494 Views
BABS 502. Lecture 9 ARIMA Forecasting II March 23, 2009. Content. The Box-Jenkins Modeling Process Seasonal ARIMA Models Concluding comments on ARIMA models. The Box Jenkins Approach to forecasting with ARIMA models. Identification Fitting Diagnostics Refitting if necessary

E N D
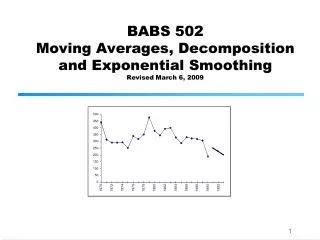
BABS 502 Lecture 9 ARIMA Forecasting II March 23, 2009
Content • The Box-Jenkins Modeling Process • Seasonal ARIMA Models • Concluding comments on ARIMA models © Martin L. Puterman 2008
The Box Jenkins Approach to forecasting with ARIMA models • Identification • Fitting • Diagnostics • Refitting if necessary • Forecasting © Martin L. Puterman 2008
Identification • What does the data look like? • What patterns exist? • Is the data stationary? • Tools • Plots of data • PACF • ACF © Martin L. Puterman 2008
Model Fitting • Trial model is proposed • e.g. ARIMA(0,1,2) • Model parameters are estimated using statistical software • Output includes • Parameter estimates • Test statistics • Goodness of fit measures • Residuals • Diagnostics © Martin L. Puterman 2008
Diagnostics • Determines whether model fits data adequately. • The goal is to extract all information and ensure that residuals are white noise • Key measures • ACF of Residuals • PACF of Residuals • Ljung-Box-Pierce Q Statistic (Portmanteau Test) • Tests whether a set of residual autocorrelations is significantly different than zero. • See next slide for details • If model deemed adequate, proceed with forecasting, otherwise try a new model. © Martin L. Puterman 2008
Comments on Model Adequacy Testing (NCSS Documentation) • The Portmanteau Test (sometimes called the Box-Pierce-Ljung statistic) is used to determine if there is any pattern left in the residuals that may be modeled. This is accomplished by testing the significance of the autocorrelations up to a certain lag. In a private communication with Dr. Greta Ljung, we have learned that this test should only be used for lags between 13 and 24. The test is computed as : where rjis the jth residual autocorrelation. • Under H0: All residual autocorrelations equal zero; Q(k) is distributed as a Chi-square with (K-p-q-P-Q) degrees of freedom where p,q,P and Q are the model orders. © Martin L. Puterman 2008
Forecasting with ARIMA models • ARIMA forecasting is done automatically in any statistical program. • You should try to figure out how this works in terms of the equation for the model. • It helps to write out model equation • This is complicated with seasonal models • Using the Backshift operator Bkxt = xt-k helps. • In AR portion of models use past values in forecasts • In MA portion of models use past residuals in forecasts. • Prediction intervals are usually very wide; out of sample forecast errors might be more reliable. © Martin L. Puterman 2008
Google Share Price Forecasting Series Monthly price (Jan 23, 2006 – March 3, 2008) Model Regular(1,1,0) Seasonal (No seasonal parameters) Observations 111 Root Mean Square 20.12511 Model Estimation Section Parameter Parameter Standard Prob Name Estimate Error T-Value Level AR(1) 0.2383635 .009 2.5978 0.009382 Forecast of price Row Date Forecast Lower Upper 95% Limit 112 2094 423.5 360.7 486.3 113 2095 421.3 340.4 502.3 114 2096 420.8 324.8 516.8 115 2097 420.7 311.6 529.8 116 2098 420.7 299.9 541.4 Fitted Model Xt+1-Xt = .238 (Xt – Xt-1) or Xt+1 = Xt + .238 (Xt – Xt-1) One Step Ahead Forecast = 432.70 + .238 * (432.7 – 471.2) = 423.5 © Martin L. Puterman 2008
Seasonal ARIMA Models • Basic concept is to add extra terms to model that take into account a persistent seasonal pattern • For example, a AR model for monthly data may contain information from lag 12, lag 24, etc. • i.e. Yt = A1Yt-12 +A2 Yt-24 + et • This is referred to as an ARIMA(0,0,0)x(2,0,0)12 model • General form is ARIMA(p,d,q)x(ps,ds,qs)s • This combines both non-seasonal and seasonal terms • This provides a broader class of models so the challenge is to select a model from a larger class. © Martin L. Puterman 2008
Wages Data Observe data is non-stationary © Martin L. Puterman 2008
Differenced Wages Data Autocorrelations of Wages (1,0,12,0,0) Lag Correlation Lag Correlation Lag Correlation Lag Correlation 1 -0.055496 11 0.062967 21 0.200640 31 0.013874 2 -0.004269 12 0.506937 22 0.016009 32 0.152615 3 0.298826 13 -0.056564 23 0.008538 33 0.077908 4 0.108858 14 0.041622 24 0.494130 34 0.013874 5 0.073639 15 0.287086 25 -0.024546 35 0.118463 6 0.121665 16 0.001067 26 0.058698 36 0.328709 7 0.048026 17 0.088581 27 0.200640 37 -0.086446 8 0.069370 18 0.092850 28 0.003202 38 0.028815 9 0.218783 19 0.010672 29 0.036286 39 0.205977 10 0.044824 20 0.115261 30 0.091782 40 -0.066169 Significant if |Correlation|> 0.237356 © Martin L. Puterman 2008
Model Fitting ARIMA(0,1,3)x(0,0,1)12 Model Estimation Section Parameter Standard Prob Name Estimate Error T-Value Level MA(1) 0.1390065 0.1200761 1.1577 0.247006 MA(2) 1.547035E-02 0.1202638 0.1286 0.897645 MA(3) -0.2083403 0.1170662 -1.7797 0.075128 SMA(1) -0.5427189 0.1019158 -5.3252 0.000000 Ljung-Box 24 20 34.96 0.020343 Inadequate Model © Martin L. Puterman 2008
Model Fitting ARIMA(0,1,3)x(0,0,2)12 Model Estimation Section Parameter Standard Prob Name Estimate Error T-Value Level MA(1) 0.2134133 0.1150536 1.8549 0.06361 MA(2) 7.882232E-02 0.1161695 0.6785 0.49744 MA(3) -0.3358605 0.1119487 -3.000 0.00269 SMA(1) -0.4282575 0.1181367 -3.625 0.00028 SMA(2) -0.8555523 6.011709E-02 -14.23 0.00000 © Martin L. Puterman 2008
Model Fitting ARIMA(0,1,0)x(1,1,0)12 Model Estimation Section Parameter Parameter Standard Prob Name Estimate Error T-Value Level SAR(1) -0.5495576 8.447082E-02 -6.5059 0.000000 © Martin L. Puterman 2008
Model Comparison But we are concerned about forecasting and should compare models out of sample (usually simpler models are better). Also – forecasts from the last model looks most reasonable. © Martin L. Puterman 2008
Concluding Comments • The ARIMA models are not designed for models with multiplicative seasonality. In such cases; • Use log transforms. • De-seasonalize and use ARIMA on de-seasonalized data. • Models with persistent trends can be de-trended and ARIMA applied to the de-trended series. • Several automatic fitting programs do a good job fitting ARIMA models • Parsimony is desirable – use models with as few as terms as possible • AIC and BIC criterion penalize number of terms in the model • Theoretical result – any high order MA model can be written as a low order AR model and vice versa; e.g. an MA(6) can be closely represented by an AR(1) or AR(2) model • Key point – Above approach to model selection is based on in sample fitting • Need to compare all models on the basis of out-of sample forecasts on holdout data. • Simpler ARIMA models seem to work better out of sample even though they may not give the best fit. • Recall from early slides that fitting is different than forecasting. • ARIMA models forecast can be pooled with those from other models. © Martin L. Puterman 2008