Download
1 / 43
430 likes | 515 Views
Patients.txt. Variable Name Description Type Valid Values PATNO Patient Number Character Numerals GENDER Gender Character ‘M' or 'F' VISIT Visit Date MMDDYY10 Any valid date HR Heart Rate Numeric 40 to 100

E N D
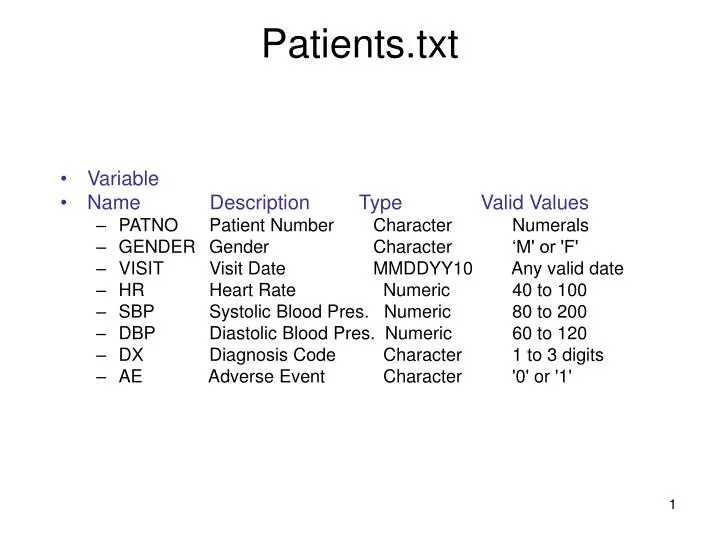
Patients.txt • Variable • Name Description Type Valid Values • PATNO Patient Number Character Numerals • GENDER Gender Character ‘M' or 'F' • VISIT Visit Date MMDDYY10 Any valid date • HR Heart Rate Numeric 40 to 100 • SBP Systolic Blood Pres. Numeric 80 to 200 • DBP Diastolic Blood Pres. Numeric 60 to 120 • DX Diagnosis Code Character 1 to 3 digits • AE Adverse Event Character '0' or '1'
Patients.txt • Variable • Name Description Type Valid Values • PATNO Patient Number Character Numerals • GENDER Gender Character ‘M' or 'F' • VISIT Visit Date MMDDYY10 Any valid date • HR Heart Rate Numeric 40 to 100 • SBP Systolic Blood Pres. Numeric 80 to 200 • DBP Diastolic Blood Pres. Numeric 60 to 120 • DX Diagnosis Code Character 1 to 3 digits • AE Adverse Event Character '0' or '1'
HR - Heart Rate (BETWEEN 40 AND 100) • SBP - systolic Blood Pressure (BETWEEN 80 AND 200) • DBP - Diastolic Blood Pressure (Between 60 to 120)
Data integration • combining/merging data from heterogeneous data sources. • is the process of combining data residing at different sources (internal data sources and external data sources) • providing the user with a unified view of these data.
SCHEMA INTEGRATION • use different representations or definitions of schema but it refers to or represent the same information. • as the entity identification problem.
For example • How can we identify that customer_id in one data set and customer_no in another refer to the same entity?
Schema matching • Currently, most of the schema matching is done manually. • tedious, • time-consuming, • error-prone.
We need automated support for schema matching • faster, • error-free and • less labor-intensive.
Correlation Analysis • Redundancy • apply correlation analysis
Correlation Analysis • Given two attributes (X1, X2); • Measure the correlation of one attribute (X1) to another attribute (X2).
Correlation Analysis • Table 2 is generated by the following criteria: • i) For the number of bytes in the attributes, if total number of bytes is less than or equal to 8 byte, we put it as 1, else it would be 0. • ii) For 1 attribute frequently access, we propose to sum the total frequency of one attribute, which is (6 1+2) = 9. The average frequently accessed = 9 / 3 = 3. Any number which is less than average frequently accessed, would be converted into 0, else it is 1.
Correlation Analysis • We apply correlation analysis to find out among attributes where are pairs as a redundancy.
Correlation Analysis • If the resulting value is greater than 0, then X2 and X3 are positively correlated. • The higher the value (approaching 1), the more each attribute implies the other. • Therefore, it is recommended that X2 (or X3 ) may be removed as they are redundant variables.
Clustering • To explain how we apply a clustering algorithm to generate clusters, • we assume that a relation has 10 attributes involved in query processing. • Furthermore, one disk page can only take less than 100 bytes
Clustering • Table 6.1 shows the length of each attributes. • We use a frequent access table to keep track the number of times users access in a particular relation as shown in Table 6.1. • When the users access the relation, the frequent access table will be updated. The frequent access table also shows the length of attribute.
Clustering • From Table 6.1, we would like covert those numeric figures into Y or N condition based on some criteria. • We propose the following converting scheme: • For number of bytes in the attributes, if total number bytes less than one fetch of instruction cycle way 100 byte, we put it as Y else it would be N. • For 1 attribute frequently access, we propose to sum the total frequent of one attribute which is (7 + 2 + 4 + 3 + 2 + 8 + 5 + 4 + 9 + 3) = 47. • The average frequently access = 47 / 10 = 4.7. • Any number is less than average frequently access, we would like to convert it into N else it is Y.
DATA TRANSFORMATION • In metadata, a data transformation converts data from a source data format into destination data.