Download
1 / 32
320 likes | 459 Views
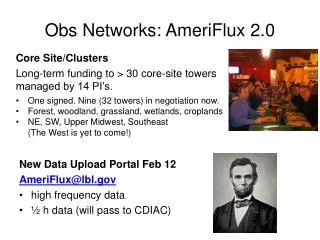
AmeriFlux QA Lab Update. Chad Hanson, Andres Schmidt, Bev Law. Oregon State University, Corvallis Oregon. Mission :. To Reduce uncertainties in flux measurements and improve data quality within and among AmeriFlux sites Site comparison of flux system to a portable standard

E N D
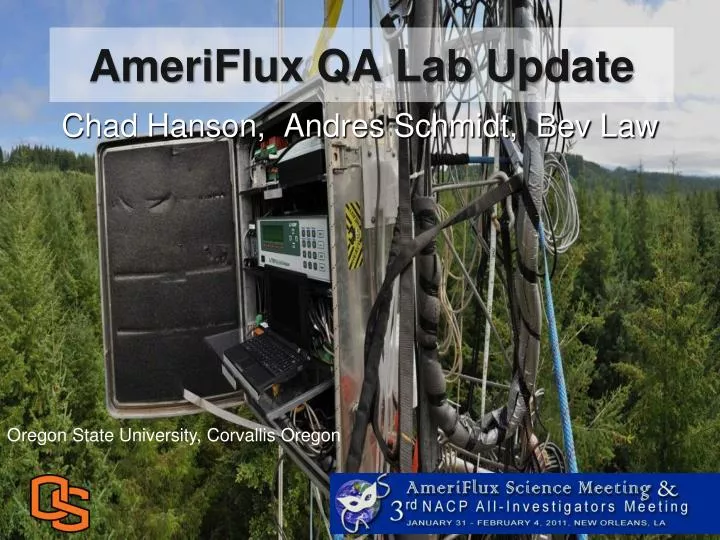
AmeriFlux QA Lab Update Chad Hanson, Andres Schmidt, Bev Law Oregon State University, Corvallis Oregon
Mission: To Reduce uncertainties in flux measurements and improve data quality within and among AmeriFlux sites • Site comparison of flux system to a portable standard • Processing of gold files • Reference standards for the network
Overview • Site comparisons • Common measurement issues • QA resources • Emerging technologies
Portable System • Closed-path IRGA LI7200 –validated winter/spring 2010 and deployed for 2010 field season (please see poster with LI-COR) • CSAT3 sonic anemometer • PT100 temperature sensor • CNR1 net radiometer • Delta T SPN1 direct and diffuse Pyranometer • PT110 atmospheric pressure transducer • CR5000 data logger • mini PC • Verizon remote data link
Portable System Calibrations • IRGAs 5 primary standards for CO2, H2O 8 points using LI610 and chilled mirror, recalculate internal polynomials annually over constrained concentration range • PAR Annual lab calibration using LICOR 1800-02 calibration unit with NIST traceable lamp • PT100 3 point calibration: H2O freezing point, boiling point, and Gallium cell melting point (26.771oC) every year • CNR1 Factory calibration once every two years • SPN1 Factory calibration once every two years
Site visits • QA team is a resource and are here to help • Focus is on working with sites to help solve issues together
Site visits • 140 comparisons since 1997 • Changed to longer visits in 2008 • Sites are selected based on history of comparisons (never visited=highest priority followed by oldest visited sites)
2009 Site Visits • Donaldson (James Kathilankal) • GLEES Wyoming (James Kathilankal) • Ames Iowa Brooks field site 10 (James Kathilankal) • Ames Iowa Brooks field site 11 (James Kathilankal) • Mead Nebraska-Rainfed (James Kathilankal) • Rosemount –G19, MN (James Kathilankal) • Marys River Fir site, OR (Andres Schmidt) • Kendall Grassland, AZ (Andres Schmidt, James Kathilankal) • Flagstaff Wildfire, AZ (James Kathilankal)
2010 Site Visits • TonziRanch, California (Andres Schmidt) • MetoliusYoung Pine, Oregon (James Kathilankal) • Sky Oaks Young Stand, California (Andres Schmidt) • Santa Rita Creosote, Arizona (Andres Schmidt) • North Carolina Clear Cut (James Kathilankal) • North Carolina Loblolly Pine (James Kathilankal) • SevilletaDesert Shrubland, New Mexico (Andres Schmidt) • SevilletaDesert Grassland, New Mexico (Andres Schmidt) • Howland Forest, Maine (James Kathilankal) • SierranMixed Conifer, California (Andres Schmidt) • SGP, Oklahoma (James Kathilankal)
Distribution of Relative Error Same sites tend to have errors in multiple components of flux measurements (~25% of sites.)
How good is good? • FC ~ ±5% random error (Goulden et al. 1996, Moncrieff et al. 1996). IRGA drift, frequency corrections (2-3%), lack of appropriate span gas (above measurement range) • LE - H2O concentration is difficult to calibrate and lack of calibration in general drive errors • Focus on visiting new and never visited sites means sample is not random
Common Solutions • Regular IRGA calibration • Out of level radiation sensors (vibrations, hot/cold, can loosen over time) dirt dust • Incorrect timestamp • Incorrect lag corrections • Magnetic declination orientation errors-important for long term records
Common Solutions • Aspirate temperature sensor • Mixed up calibration coefficients for multiple sensors (profile measurements for PPFD, temperature and humidity, etc.) • CNR1 net radiometer (No temperature correction for LW measurements, heater on unnecessarily or not on in winter)
Outcomes • Generate site report after working with sites • We need to hear back on resolution of discrepancies more often • Working on adding QA fields to data base to document site visits and resolutions for data users • We encourage PI’s to give us feedback on site visits to help us serve the needs of the network
PAR • Began calibrating and distributing reference sensors in 2007 due to discrepancies in PAR during site visits
PAR Sensor Calibration • Reference sensors are calibrated against a NIST traceable calibration lamp in a LI-COR 1800-02 Calibration unit. • Spectral corrections applied to account for non ideal sensor response and differences in irradiance of calibration lamp and ISO global clear sky standard.
What drives PAR errors? • Drift (calibration frequency) • Spectral response issues • Different calibration methods • Poor leveling/cleaning
Drift is real-why calibrations must be kept up to date! Data Provided by Terrestrial Ecosystems Research Associates, Corvallis, OR
Real Spectral Response Different spectral responses yield different behavior in upwelling measurements
Different calibration methods result in systematic errors (2-12%)
Final thoughts on PAR • Parameterization of global models for quantum use efficiency, stomatalconductance and other relationships can compound/leverage PAR errors • Manufacturers need to standardize PAR calibration procedures • Sites that have largest PAR errors would still benefit from any calibration if done annually
AmeriFlux QA resources • Secondary standards • PAR reference sensors • Temperature (4 PT100’s) • CO2 • Standardized protocols • Gold files
Temperature Calibration • 4 reference PT100’s available to network • 3 point calibration; freezing point of water, gallium melting point (26.771 ºC), boiling point of water
Secondary CO2 Standards • Should be used to correct calibration of span gases used for regular field calibrations • High altitude marine source air collected at Pine Mountain Observatory, OR • Volume blended in lab to create different concentrations
Secondary CO2 Standards • Calibrated against 5 WMO standards on a Picarro EPS-1000 with typical expanded uncertainties of ± 0.17 ppm
Emerging technology • Beta testing Cavity Ring Down Spectroscopy instruments from Picarro for high precision CO2 , H2O and CH4 flux measurements. • Beta tested LICOR LI-7200 in spring of 2010 –please see poster
Thank You • QA team • Andres Schmidt • James Kathilankal • Bev Law • Everyone in the AmeriFlux network • Sign up for 2011 site visits!