Download
1 / 21
210 likes | 341 Views
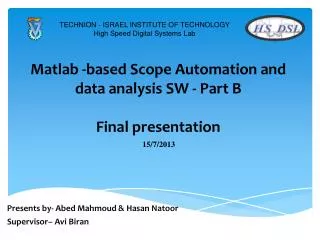
Matlab -based Scope Automation and data analysis SW. 29/05/2012. Presents by- Abed Mahmoud & Hasan Natoor Supervisor– Avi Biran. Agenda. Introduction Project’s Goals Flowchart of the functions Settings of Scope CW SNR simulator Zero crossing algorithm (SNR) calculations

E N D
Matlab -based Scope Automation and data analysis SW 29/05/2012 Presents by- Abed Mahmoud & HasanNatoor Supervisor– AviBiran
Agenda • Introduction • Project’s Goals • Flowchart of the functions • Settings of Scope • CW SNR simulator • Zero crossing algorithm (SNR) calculations • Signal-to-Noise ratio • Clock signals jitter simulator * Jitter statistical analysis and histograms • “Real-life” signals captured from scope RAM * CW signal analysis * Clock “rect” signal analysis • Next stages
Introduction Scope is utilized as a primary testing instrument for time domain signals. Its multichannel and coherent sampling capabilities makes it useful for a variety of applications in different and complex engineering disciplines. Automation of the scope is essential for an efficient utilization of the platform. MATLAB, in conjunction with its Instrumentation Control Toolbox , is an ideal SW platform to both control the instrument parameters and acquisition properties, as well as post-process the acquired data arrays.
Project’s Goals Remote control of platform settings Capture and import Data matrices from the scope channels directly into Matlab On/off -line data processing Building a user-friendly GUI
Proposed methodology Building a dedicated, GUI-assisted, interface scripts for an embedded device control and using the vendor-specified SCPI commands Utilization of the Matlab Instrumentation Control Toolbox as the SW platform Using Matlab signal-processing and display functions for on-line analysis the captured waveforms and provide graphical displays of the post-processed functions
Main accomplishment Automation of Infiniuum settings and data acquisition, including built-in AGC. Building a Matlab-based simulators for generation of noisy CW & Clock Signals and statistical analysis of SNR & Jitter parameters Calculation SNR & Jitter on “real-life” captured signals.
Flowchart of the functions AGC (optional) • Parameters definition: • X,Y scaling • Sampling rate • Acquisition mode (ASCii-Byte-Word) • Data processing type (CW/Clock) • Active channels • Length record • Scope run: • Capture and import Data matrices from the scope channels, save traces • On-line data processing • Display analysis data (SNR/Jitter) Scope set AGC
AGC operation Aimed to optimize the captured signal dynamic range & avoid signal clipping • Capturing the signal from scope screen and import captured data matrices • Activate AGC : • If the amplitude of the signal significantly smaller relatively to the full Y-span – decrease the Y-scale to match the signal p.t.p amplitude • If the amplitude of the signal higher than the full-span Y-scale - increase the Y-scale to match the signal p.t.p amplitude
AGC-example 240-level dynamic range 1-bit resolution dynamic range Reduce the Y-scale to optimize the signal dynamic range
Signal processing simulator (a):CW-SNR Sin signal noised signal Zero crossing FFT Signal-Noise ratio (out) + Random noise Signal-Noise ratio (in) compare CW (sine or cosine) waveforms – calculations of Signal-to-Noise (SNR) ratio.
Zero- Crossings(ZC) algorithm Truncate the signal length so that the signal is composed of an integer number of CW periods For exact calculation of the CW signal spectral response characteristics, an integer number of cycles is essential. ZC algorithm is employed to allow this calculation:
Signal-Noise ratio (out) SNR=a/b Use FFT calculate the center frequency. Calculate energy of the signal at the center frequency(a) Integrate the energy of the out-of-peak data points to calculate the energy of noise(b)
Signal-processing simulator (b):Clock Jitter Rectangle signal Estimate the ZC points Compute time-span between any two ZC points Sin signal with Phase Noise Estimated time period calculated by the main frequency Fourier domain eliminate bad data points Calculate mean time period and STD Histogram display Clock waveforms: calculations of Jitter parameters.
Calculated Jitter parameters: Average: 0.2 [usec] s= 0.02 [usec]
“Real life” acquired signals examples: CW signal analysis:
“Real life” acquired signals examples: Clock “rect” signal analysis:
What’s next? GUI. Advanced Jitter analysis. Automation of Tabor signal generator.