Download
1 / 27
270 likes | 272 Views
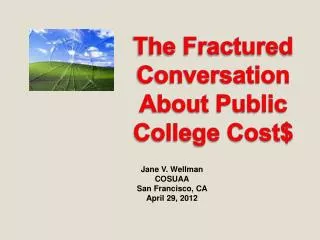
The Fractured Conversation About Public College Cost$. Jane V. Wellman COSUAA San Francisco, CA April 29, 2012. College Prices Growing …. % Change in College Sticker Price against other consumer Areas – 1999/00 – 2010/11. 3. Declining Household Income.

E N D
The Fractured Conversation About Public College Cost$ Jane V. Wellman COSUAA San Francisco, CA April 29, 2012
College Prices Growing … % Change in College Sticker Price against other consumer Areas – 1999/00 – 2010/11 3
Declining Household Income …. Against declines in median family incomes Real household income has fallen by about 10 percent since the start of the last recession, with a greater decline after the recession ended. http://www.nytimes.com/interactive/2011/10/10/us/declining-household-income.html?ref=us
A declining share of Americans agree that a college education is affordable Do you agree or disagree with the following statement: College costs in general are such that most people are able to afford to pay for a college education. (Asked of general public)
Only 40% feel that the value for the money spent on higher education is excellent or good… How would you rate the job the higher education system in this country is doing in terms of providing VALUE for the money spent by students and their families? (Asked of general public)
CFO Opinions about effectiveness of the budget model - % reporting it to be ‘Effective or very effective’ 39.7% Overall model is effective or very effective 49.9% Helps us to manage during good times 36.7% Helps us to manage during difficult times 27.6% Helps us re-assess priorities 20.9% Helps develop a business plan for new academic programs Inside Higher Education , 2011 Survey of College and University Business Officers, July 2011.
The context for state funding of postsecondary education: Exploding demand – nationwide up 6X growth in K-12 since 2000
Spending patterns across state budgets • State policy makers & budget officials argue that – up until 2009 – states were increasing spending for higher education… • Spending has increased overall in most areas – including higher education • BUT … • Figures are not adjusted for population • NASBO and SHEEO education figures include revenues from tuition and fees as well as state funding – and most of the ‘new money’ in higher education is from tuition • On a per capita basis, higher education finance has been reduced – although not as much as public assistance • But virtually all areas of spending have seen reductions – EXCEPT for medicaid
Compared to…. Nationwide changes in populations in major areas of state funding 1985 – 2010 • K-12 education: +21% • Public sector postsecondary undergraduate enrollments: + 60% • Private sector postsecondary undergraduate enrollments: + 102% • Higher education graduate enrollments: + 85% • Medicaid/care population: +210% • Corrections inmates: +102%
But per capita spending for higher education is declining, as is the higher education share of state spending • Nationwide, state spending on higher education has declined from 12.3% to 10.1% of state spending • Other areas of state spending also declined – against state spending for medicaid that has more than doubled • Per capita state (public funding excluding tuition) spending for higher education has been reduced more than any other area
The problem of instability • State appropriations for higher education show more variation from year to year than other areas of state funding – up in times of growth, down following recessions, with an overall downward path
“Grapevine” survey data, 1960-2012, not adjusted for FTE or inflation
Spending for higher education v. medicaid and corrections – adjusted for FTE/population and CPI inflation – Higher education shows a 20% point difference between high and low points Versus a 12% variation in medicaid And a 2% range in corrections
State fiscal survey 2012 • NASBO survey results report total state general funds, not adjusted for inflation or for workload. (National Association of State Budget Officers) • State general funds are beginning to recover from historic lows in the 2011 and 2012 years, but remain below 2008 levels by nearly $21 billion. 2009 and 2010 saw absolute declines in state spending – the first time of such declines in the 50+ year NASBO history. • In FY 2011, general fund spending increased an average of 4% above 2010 levels, and is projected to decline slightly in 2012 to a national average closer to 3% in 2012. • In 2011, 12 states saw absolute declines in spending; 23 grew between 1 and 5%, and 15 more than 5% • New revenue for higher education remains a long way off in most states, in large part because of continued growth in spending on Medicaid, now consuming 24% of all state spending, up 10% overall in 2011, and projected to grow an average of 8% per year for the next decade.
State spending and revenue – 2007 – 2012 Source: NASBO fiscal survey of the states, January 2012.
Spending is not increasing as fast as tuition • The price/spending gap is biggest among public community colleges • Net tuition revenue up 35% in 9 years • Against virtually NO CHANGE in spending per student • And declines in state/local appropriations of 5% in 9 years
The unsustainable cost model: gaps in tuition revenue v. spending, public community colleges, 2000 – 2009 All figures are in 2009 constant dollars, per FTE student. Source, Delta Data base.
Similar patterns – but real increases in spending/student in public four-year institutions • Public masters’ spending/student/year about 1%/year between 2000 – 2009 • Against tuition increases averaging 5%/year • And state budget cuts averaging 0.5%/year
The unsustainable cost model: gaps in tuition revenue v. spending, public research universities, 2000 – 2009 All figures are in 2009 constant dollars, per FTE student. Source, Delta Data base.
Contrary to perceptions that faculty are driving spending increases, there’s no evidence of that in spending patterns among public institutions, where the instructional share of spending is largely stable albeit declining slightly Source: Delta Cost Project IPEDS database, 1987-2009, 11-year matched set.
New money versus new students—enrollment growth is concentrated in public institutions, which have had less access to new resourcesTen-year change in enrollment versus 10 year change in spending per FTE student, AY1999-2009 (in 2009 dollars)