Download
1 / 11
110 likes | 202 Views
Evaluate DNA band sizes and allelic presence from PCR results using specific ladder data. Analyze D1S80 and TnpA gel electrophoresis for genetic investigation.

E N D
Use the two following slides as examples for your lab report. We did not add control PCRs with no DNA on these gels. How would it have helped this analysis to have a no DNA control PCR reaction along side each reaction shown on the D1S80 gel? Print out the slides, I suggest you make them one page each. D1S80: answer the questions in the lab protocol, the question above and the question on the bottom of this slide. Use the 100 bp ladder (not 123 bp this time) to make a graph to estimate the sizes of the DNA bands for the D1S80 results. Ignore lanes with no bands, If there are more than two bands, choose the two brightest. You will not be penalized for picking the wrong two bands. Your gels are posted below starting with slide 4. Why can we not interpret these results for D1S80? Remember that every other lane has no DNA template added to the DNA reaction.
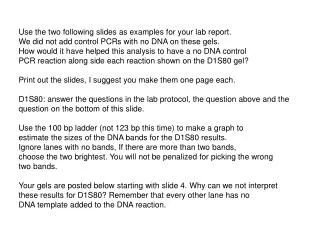
PCR results: DIS80 TLC KET MAL RGL HRP KAT MW ME WB GH PY BA EH EH SV SL JL 400bps 300bps 200bps 100bps Everyone has one or two alleles Choose the brightest bands Some samples did not work
PCR results: TPA TLC KET MAL RGL HRP KAT MW ME WB GH PY BA EH EH SV SL JL 400bps 100bps
D1S80 gel A 100 bp ladder + DNA No DNA 123 bp ladder + DNA No DNA + DNA No DNA
D1S80 gel B 100 bp ladder 100 bp ladder + DNA No DNA No DNA No DNA + DNA + DNA No DNA + DNA
D1S80 gel C 100 bp ladder 100 bp ladder No DNA + DNA No DNA No DNA + DNA + DNA + DNA + DNA No DNA No DNA No DNA + DNA + DNA No DNA + DNA No DNA + DNA No DNA
D1S80 gel D 100 bp ladder 100 bp ladder No DNA No DNA No DNA + DNA + DNA + DNA + DNA No DNA + DNA No DNA + DNA No DNA
TnpA gel A + DNA No DNA + DNA No DNA No DNA 123 bp ladder + DNA No DNA + DNA
TnpA gel B 1kb ladder + DNA + DNA + DNA + DNA + DNA + DNA No DNA No DNA No DNA No DNA No DNA + DNA No DNA No DNA + DNA No DNA
TnpA gel C 1kb ladder + DNA + DNA + DNA + DNA No DNA + DNA + DNA + DNA No DNA No DNA No DNA No DNA No DNA + DNA No DNA No DNA + DNA No DNA 400 bp 100 bp
TnpA gel D This lane has the expected bands + DNA + DNA No DNA 1kb ladder + DNA No DNA No DNA + DNA No DNA + DNA No DNA No DNA + DNA + DNA No DNA No DNA + DNA + DNA No DNA No DNA + DNA 400 bp 100 bp