Download
1 / 19
190 likes | 292 Views
Measuring Decision Weights of Ambiguous Events by Adapting de Finetti's Betting-Odds Method to Prospect Theory. Don’t forget to make yellow comments invisible.

E N D
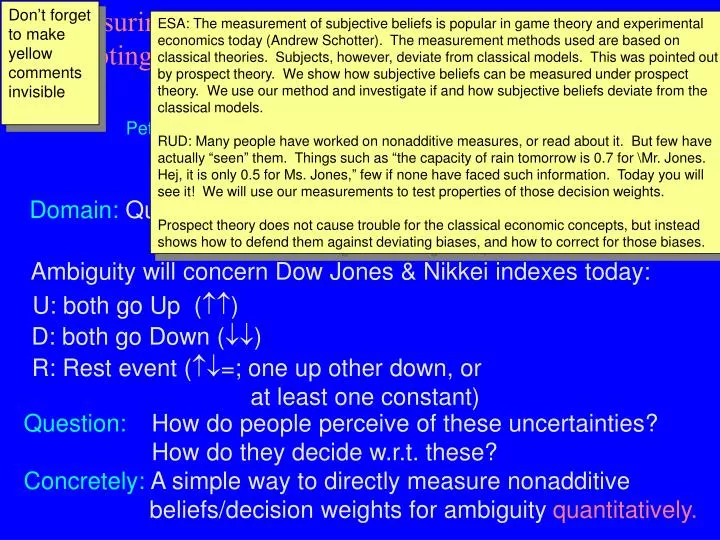
Measuring Decision Weights of Ambiguous Events by Adapting de Finetti's Betting-Odds Method to Prospect Theory Don’t forget to make yellow comments invisible ESA: The measurement of subjective beliefs is popular in game theory and experimental economics today (Andrew Schotter). The measurement methods used are based on classical theories. Subjects, however, deviate from classical models. This was pointed out by prospect theory. We show how subjective beliefs can be measured under prospect theory. We use our method and investigate if and how subjective beliefs deviate from the classical models. RUD: Many people have worked on nonadditive measures, or read about it. But few have actually “seen” them. Things such as “the capacity of rain tomorrow is 0.7 for \Mr. Jones. Hej, it is only 0.5 for Ms. Jones,” few if none have faced such information. Today you will see it! We will use our measurements to test properties of those decision weights. Prospect theory does not cause trouble for the classical economic concepts, but instead shows how to defend them against deviating biases, and how to correct for those biases. Peter P. Wakker & Enrico Diecidue & Marcel ZeelenbergLecture + paper are on my homepage Domain: Quantitative measurement of beliefs under ambiguity. We will analyze in terms of prospect theory.. • Ambiguity will concern Dow Jones & Nikkei indexes today: • U: both go Up () • D: both go Down () • R: Rest event (=; one up other down, or • at least one constant) Question: How do people perceive of these uncertainties? How do they decide w.r.t. these? Concretely: A simple way to directly measure nonadditive beliefs/decision weights for ambiguity quantitatively.
2 Some History of Prospect Theory For gains only today. Then prospect theory = rank-dependent utility = Choquet expected utility. 1950-1980: nonEU desirable, nonlinear probability desirable. 1981 (only then): Quiggin introduced rank-dependence for risk (given probabilities). Greatest idea in decision theory since 1954!?!? 1989: Schmeidler did the same independently. Big thing:Schmeidler did it for uncertainty (no probabilities given). Up to that point, no implementable theory for uncertainty to deviate from SEU. (Multiple priors not yet implementable!?) Uncertainty before 1990: prehistorical times! Only after, Tversky & Kahneman (1992) could develop a sound prospect theory, thanks to Schmeidler. ESA’04: skip rest page Multiple priors had existed long before. It is often used in theoretical studies. I am not aware of a study that empirically measured multiple priors, and do not know how to do that in a tractable manner.
3 Restrictive Assumption about Utility in Our Analysis de Finetti’s betting-odds system assumes linear utility. Our analysis maintains this assumption. Reasonable? Outcomes between Dfl10 (€4.5) and Dfl100 (€45). Are moderate, and not very close to zero. Then utility is approximately linear. References supporting it: de Finetti 1937; Edwards 1955; Fox, Rogers, & Tversky 1996; Lopes & Oden 1999 p. 290; Luce 2000 p. 86; Rabin 2000; Ramsey 1931 p. 176; Samuelson 1959 p. 35; Savage 1954 p. 91. Special dangers of zero-outcome: Birnbaum. Modern view: Risk aversion for such amounts is due to other factors than utility curvature (Rabin 2000). Axiomatizations of prospect theory with linear utility: Chateauneuf (1991, JME), Diecidue & Wakker (2002, MSS). ESA’04: say rest page in one line Reasonable!?
U D R U D R 9 7 5 2 8 6 ( ( ) ) For philosphers: You can claim that probabilities should be nonadditive, but for decision theory that as such doesn’t mean anything. 4 A Reformulation of Prospect-Theory (= Rank-Dependent-Utility = Choquet-Expected-Utility) through Rank-Dependence of Decision Weights For specialists, remark that there are two middle weights but for simplicity we ignore difference. • (Subjective) expected utility (linear utility): m w b evaluated through U9 + D7 + R5. w m b evaluated through U2 + D8 + R6. (Cumulative) prospect theory generalizes expected utility by rank-dependence (“decision-way” of expressing nonadditivity of belief). Properties of rank-dependent decision weights:
Uncertainty aversion No rank-dependence U m U U m m > = < U U U U U U U U U U U U U b w w b w b w b b w m m m > > > > = < > p 5 Note that we do unknown probs; figures only suggestive. linear Classical: (rational!) Economists usually want pessimism for equilibria etc. Pessimism: convex (overweighting of bad outcomes) Optimism: concave (overweighting of good outcomes) (Likelihood) insensitivity: inverse-S (overweighting of extreme outcomes) Empirical findings: inverse-S (lowered) (Primarily insensitivity; also pessimism; Tversky & Fox, 1997; Gonzalez & Wu 1999 )
U m U U w b > > 6 Our empirical predictions: 1. The decision weights depend on the ranking position. 2. The nature of rank-dependence: 3. Violations of prospect theory … see later. Those violations will come quite later. First I explain things within PT and explain and test those. Only after those results comes the test of the violations. But one violation will be strong, so, if you don’t like PT, keep on listening!
7 • Real test of (novelty of) rank-dependence needs at least 3-outcome prospects (e.g. for defining m's). • Empirical studies of PT with 3 outcomes (mostly with known probs): ESA’04: rest page in one sentence • Many studies in “probability triangle.” Unclear results; triangle is not suited for testing PT. • Other qualitative studies with three outcomes: • Wakker, Erev, & Weber (‘94, JRU) • Fennema & Wakker (‘96, JRU) • Birnbaum & McIntosh (‘96, OBHDP) • Birnbaum & Navarrete (‘98, JRU) • Gonzalez & Wu (2004) • Lopes et al. on many outcomes, complex results. • Summarizing: no clear results! Most here is for DUR.
Which would you choose? ? ) ) ( ( U D R U D R 103 47 12 94 64 8 8 ESA: skip this page. Shows how hard 3-outcome-prospect choices are. We developed special layout to make such choices transparent. • Taking stock. We: • Tests the novelty of PT • by measuring decision weights of events in varying ranking positions • through choices between three-outcome prospects • that are transparent to the subjects by appealing to de Finetti’s betting-odds system (through stating “reference prospects”): see next slides. • This is how we want to make nonadditive measures/decision weights “visible.”
+ +++ 3 U > : Classical method (de Finetti) to “check” if 20 U Check if 13 D ¯¯ 46 U D R U D R U D R 3 3 U ? . b this reveals that How check if R > > 20 20 20 0 0 20 0 0 33 46 65 65 ¹ Answer: add a “reference gamble” (side payment). Check if p p Choice = · ( ( ( ) ). ) U D R U D R U D R U w refer- ence gamble +13 +46 +65 333 164968 333 +13 +46 +65 16 33 ( ( ( ) ) ) 46 49 i.e., 65 68 3 U > . Then we can conclude w 20 9 In explanation make clear that “check” means elicit from an individual from his choices. At Say that the very idea to verify from prefs, while well-known today, was an impressive step forward. Mention that we are finding out about fair price (CE-equivalent) of U. We: Layout of stimuli Explain in terms of how many utility units more than the reference gamble Before Figure-layout: So this is algebra. But, we also want it psychological, I.e., in the minds of our subjects. How can we let this take place in the minds of our subjects? This was the most difficult question in our research. We spent a year or so trying all kinds of stimuli, before we came to choose this figure. Then relate back to difficult choice on p. 8, that now it is clearer. You can see de Finetti’s intuition “shine” through, embedded in rank-dependence.
10 + + + + +++ +++ +++ +++ U D ¯¯ ¯¯ 13 13 13 13 13 13 13 13 13 13 R 46 46 46 46 46 46 46 46 46 46 p p p p p p p p Choice Choice Choice Choice 65 65 65 65 65 65 65 65 65 65 ¹ ¹ ¹ ¹ ¹ ¹ ¹ ¹ ¹ ¹ + + + + +++ +++ +++ +++ = = = = = = = = = = · · · · · · · · · · U D ¯¯ ¯¯ U w R 40 33 33 28 33 31 33 34 33 33 33 43 33 16 33 19 37 33 22 25 p p p p p p p p Choice Choice Choice Choice 70 55 73 46 76 46 58 46 46 46 52 46 49 46 64 46 46 67 61 46 + + ¯¯ ¯¯ ¯¯ ¯¯ +++ +++ U 65 65 65 86 68 92 65 95 65 65 65 77 80 65 74 65 89 83 71 65 9/20 < D ¯¯ ¯¯ R 12/20. < p p p p Choice Choice x x x x This provides a tractable manner for quantitatively measuring decision weights under ambiguity. Combines de Finetti’s betting odds schemes with rank-dependence. x x x x Imagine the following choices: 9 more for sure 20 more under U 12 more for sure x x
11 The Experiment • Stimuli: explained before. • N = 186 participants. Tilburg-students,NOT economics or medical. • Classroom sessions, paper-&-pencil questionnaires;one of every 10 students got one random choice for real. • Written instructions ESA’04: rest page in one sentence • brief verbal comment on likelihood of increases/decreases of Dow Jones & Nikkei. • graph of performance of stocks during last two months.
12 Performance of Dow Jones and Nikkei from March 16, 2001 till May 15, 2001
ordercompletely randomized 13 • Order of questions • 2 learning questions • questions about difficulty etc. • 2 experimental questions • 1 filler • 6 experimental questions • 1 filler • 10 experimental questions • questions about emotions, e.g. regret Skip most details of it.
14 Results 1st hypothesis (existence rank-dependence). ANOVA with repeated measures. Event U: F(2,328) = 9.44, p < 0.001; Event D: F(2,322) = 5.77, p = 0.003; Event R: F(2,334) = 2.80, p = 0.06. So, first hypothesis is confirmed: There is rank-dependence.
* * * * * 15 Main effect is likelihood and is just fine. Bigger overestimation of unlikely events suggests likelihood insensitivity. The *’s are violations of SEU. 2nd hypothesis (nature of rank-dependence; t-tests) middle worst best Down-event: suggests insensitivity D .34 (.18) .31 (.17) .34 (.17) middle worst best Up-event: suggests pessimism U .44 (.18) .48 (.20) .46 (.18) middle worst best Rest-event: suggests optimism R .52 (.18) .50 (.19) .50 (.18)
16 Degeneracy effects: working name, only for this paper. Prospect theory can explain more of the variance in choice than any other theory. But the total variance explained is still low. Third hypothesis (violations of prospect theory): Prospect theory accommodates the certainty effect. Are there factors beyond prospect theory (Loomes & Sugden, Luce, Humphrey, Birnbaum, etc.)? We call them degeneracy effects. If existing, do they reinforce or weaken the certainty effect?
+ + + + + + +++ +++ +++ +++ +++ +++ U D ¯¯ ¯¯ 13 16 16 13 16 13 R 46 46 46 46 46 46 p p p p p p U Choice Choice Choice w,n 65 65 46 46 65 46 ¹ ¹ ¹ ¹ ¹ ¹ U w,d = = = = = = · · · · · · U D ¯¯ ¯¯ 19 19 33 46 22 33 46 16 46 33 25 22 R 49 46 49 46 55 46 46 52 46 46 55 52 p p p p p ¯¯ ¯¯ p Choice Choice Choice 65 71 46 74 65 55 46 65 68 52 46 49 17 Stimuli to test degeneracy effects: … …
* * *** * * * * • Results concerning factors beyond prospect theory 18 middle worst best Down-event: .35 (.20) .35 (.19) degenerate suggests insensitivity D .34 (.18) .31 (.17) .34 (.17) .33 (.19) .33 (.18) nondeg. middle worst best .43 (.17) Up-event: .41 (.18) degenerate U .44 (.18) .48 (.20) .46 (.18) suggests pessimism .51 (.23) .46 (.22) nondeg middle worst best .49 (.20) Rest-event: .51 (.20) degenerate R .52 (.18) .50 (.19) .50 (.18) suggests optimism .50 (.20) .53 (.20) nondeg
19 Conclusions • For empirically measuring subjective beliefs, prospect theory has improvements to bring. • De Finetti’s betting odds can be adapted to prospect theory/rank-dependence: easy way to directly measure nonadditive decision weights quantitatively. • Using measurements, we investigated properties of rank-dependence. • Rank-dependent violations of expected utility were found. • Support for pessimism and likelihood insensitivity. • Some degeneracy effects, violating prospect theory.